
Predicting housing prices and sales using data science
Scheduling staff, purchasing more stock or predicting house prices of a specific neighborhood… These are all examples of what you can achieve using predictions. In this blog, we are going to use data science as a method to predict housing prices and sales. If you make proper use of predictions, it can set the standard for profits and growth. We will explain regression models by presenting two examples: housing prices and expected sales.
Regression
As explained in the blog using data science to decrease customer churn, classification is a powerful method of separating two (or more) entities based on their features. In our example of cats and dogs, we used features such as sleeping schedule and the sound they produce. But what if we want to predict a continuous value – say, height of a person, rather than a binary value? We could expand the classes that the model can choose from significantly, and we would still be in the realm of classification, i.e. multiclass classification problems. Bins could be created, with each bin containing a range of values. However, you could get an infinite amount of bins. As you can imagine, this is not efficient at all, both for time and space complexity.
The better option is regression. Borrowed and adapted from the statistics discipline, we will take a look at their examples. We will be considering linear regression, because it is the easiest and most straight forward method of regression. Note that logistic regression (explained in our customer churn blog) also is technically a regressor, but adapted for classification.
Example 1: predicting the house prices
Ok, enough theory, I will now bring some data to the table. If we want to predict the house prices of a specific neighborhood, we can have as many features as we want. More features mean larger vectors for the classifier. But be careful; too many features could potentially create a noise that clouds the classifier. For this example, we will be using only one feature: floor space in square meters. To link back to statistics, we consider the feature to be the independent variable, whereas the price of a house is the dependent variable. In other words, the house price is directly linked to the floor space. We assume that there is a linear relationship between these two variables.
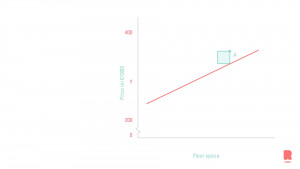
The x-axis shows the features of the dataset. In this case, that would be the floor space, the independent variable. The price on the y-axis is the target we would like to predict. The figure shows the best fitting line for our model. This line should be read as follows; if we have a house in this neighborhood with an x amount of floor space (horizontal axis), the intersect on the line gives us the price of this house, shown on the y-axis (the vertical axis).
Sum of Squares
But how does the model know which line fits the data? There are many ways to calculate the best line, but we will stay true to the statistical nature of things. By now you may have noticed a little green square in the figure. This square is the distance of the data point A (on which we train) with the potential line for the model. This distance is squared, hence the little square, and summed with all the other data points in the figure. This process is repeated many times, with many different potential model lines. The smaller the summed value, the better the line fits. Note this is a very abstract explanation of the sum of squares method.
Limitations of one feature models
In larger models the x-axis is populated with more features (higher dimensional), to make the model perform even better. Many features cannot be shown as easily on figures as we have just described. Zero features (line), one feature (2D plot), and two features (3D plot) can be shown in models. Visualizing more dimensions are not feasible in conventional ways. One feature models are rarely the golden ticket but serve as a good example of explanations.
Example 2: predicting sales for an ice cream parlor
Let’s take a look at another example. We want to predict a numeric value, which is the number of sales from an ice cream parlor. We have data from an ice cream parlor in Rotterdam, which collected sales data over the last three years. This variable, ‘sales’, is our target variable. We want to train an algorithm to understand why the amount of sales differs over time.
Getting external data on board
The internal data from the ice cream parlor is about the number of sales and when the sales happened. If we want additional information, we need external data to enrich our dataset. In this case, it might be very interesting to add weather data. Although I like ice cream, I rather eat it on a sunny day than on a cold day when it’s raining cats and dogs. Another interesting external information source might be the school holidays calendar, as we expect more families to visit the ice cream shop during the holidays.
Once we think we have gathered enough data to make a reliable prediction, we combine the internal and external data sources so that we have a proper dataset that can be used to train our algorithm. So, for example, the linear regression model will generate a prediction for the next 12 days. The weather forecast for the next 12 days and the school holiday calendar for the next 12 days are input variables (independent) for the model, which will give a prediction for the ice cream parlor in terms of his expected sales. This can help him with scheduling staff and purchasing more stock.

Related posts

Artificial Intelligence is ready!
In this interview, Jonathan Aardema talks with Prof. Eric Postma (professor of Cognitive Science and Artificial Intelligence at the University of Tilburg) about the why, how, and what of artificial intelligence applications. What do we see in practice, and what does science say about it?

Visiting London for the Tableau Partner Executive Kick-Off 2020
Every year Tableau invites its most valuable partners to kick off the new year together. The theme for this year was Accelerate, so let’s get right to the point. This exciting event was focused on three main areas.

Mastering DAX
Keeping your skills up to date is crucial when you work with the newest technology. At Rockfeather, we challenge each other to be the best version of yourself. That’s why I attended the mastering DAX course. DAX (Data Analysis Expressions) is a formula expression language. Next to Power BI, DAX is applied in Excel Power Pivot and tabular models in SQL Server. Learn it once, use it tomorrow.