
Using data science to decrease customer churn
Now that you have gained more information about the basics and fundamentals of data science, we are going to delve further into the transformation of this data. The information which results from this is all we need to decrease customer churn with data science. In this blog, we will explain classification models and present a churn use case of a football club.
Classification
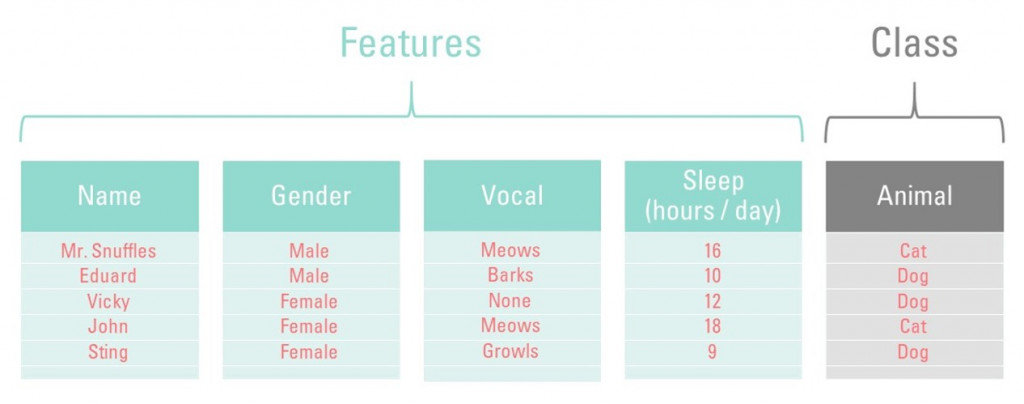
In the blog Why data science isn’t magic, we already explained the importance of data. The data transforms into information the moment we know what the data refers to. To start decreasing customer churn using data science, this information is crucial. This information is what we use as features for our machine learning tasks. As you’ll recall from our previous blog, there are two important parts of a machine learning database: the features and the class. Let us dive into the class variable, which is the ‘Animal’ column in our example.
Binary classification
There are only two values for animals: ‘cat’ and ‘dog’. Let’s assume that this dataset only consists of cats and dogs. Our churn model, once trained, can only choose between these two values (labels). We call these binary classification problems. A binary classification problem can only have two values as a class variable. In this case ‘cat’ and ‘dog’. Any class with only two labels are called binary classification problems. If you want to know whether a customer made the purchase or not, you can signify that true or false. Later you can train the model on the characteristics (features) of these customers, resulting in you knowing why a sale did or did not take place. Pretty nifty, right?
Multiclass problems
You might be thinking right now: “so, if a class with two labels exists, what about a three-labeled class?”. A class with three labels does indeed exist, just like there is a class with four, five, or twenty labels. This is called a multiclass problem. The concept is entirely the same: the churn model can predict one of the n classes, instead of just two. What happens underneath the hood, however, is where the difference between the two types of problems arise.
The difference is in the algorithms
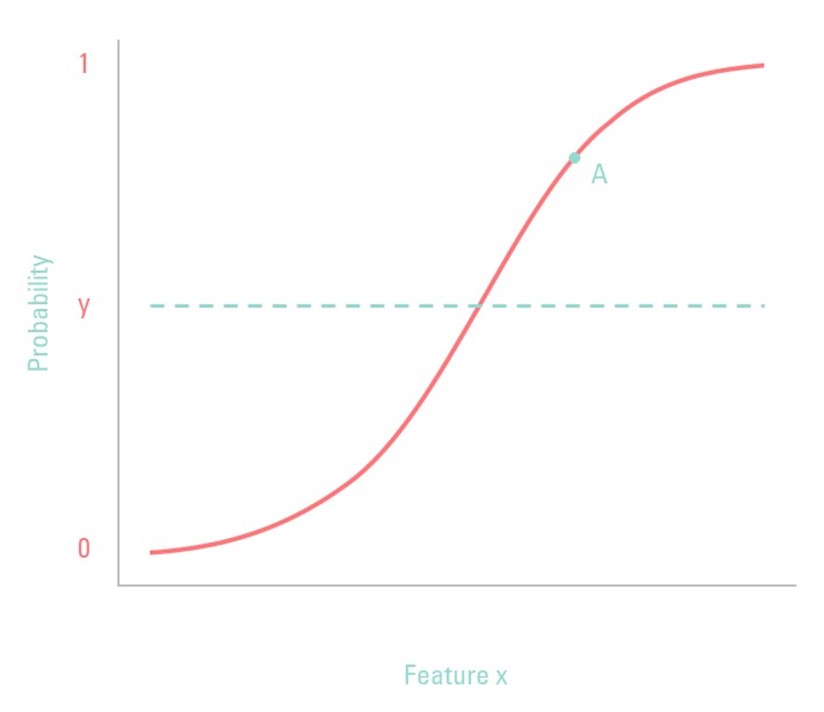
As stated before, binary classification problems have two labels; multiclass classification problems have more than two labels. The fundamental difference between the two is the algorithms that each one uses. Some algorithms are designed specifically for binary classification. Let us take logistic regression as our classifier, as this one is specifically designed for binary classification. The graph below shows the function used for logistic regression. Unlike linear regression, logistic regression only classifies between the 0 and 1, as is shown on the y-axis, whereas linear regression has a continuous value. This makes logistic regression perfect for binary classification problems.
The y-axis shows the probability for feature X. Note: the x-axis only shows one feature, but in reality, it can (and should) hold many variables for predicting the probability of the class. The line denoted by y is the threshold value: if the probability of feature X (the independent variable, for the statisticians) is above this value, the classifier will classify this element as the ‘True’ value.
An example of the model
Ok, that was quite a theoretical explanation. Allow me to demonstrate with an example. By now, you may have noticed the ‘A’ in the figure below. This point corresponds to feature X with a random value. This random value has a probability of 80% to be of class ‘True’ (in false vs. true) or ‘Overweight’ (in ‘not overweight’ vs. ‘overweight’). Or to put it differently, there is only a 20% chance that this variable corresponds to class ‘False’. In reality, logistic regression is more complex, but this illustrates the general idea.
Predicting customer churn: use-case at a football club
In this section, we will give an example of a classification case. Imagine Football Club A. Each season every football club sells season tickets to its fans. At the end of a season, Football Club A asks her fans if they want to renew their season ticket. Most fans will, but a small amount of these fans will churn, which means that they will not renew their membership. These churners will lead to a decrease in revenue, which Football Club A wants to prevent. If the football club could know which fans will churn, they could act on this by giving them extra attention and a discount. But how on earth could Football Club A know which fans will churn?
Features and target variable
Machine learning can help Football Club A by identifying these fans. Based on the seasons before, the FC knows which fans churned in the past. The FC has information about these fans, like how often they visited the matches and what the prices are for their season tickets. The football club can use this type of information as features in a machine learning algorithm. The target variable we want to predict is, in this case, ‘churn’.
The prediction
The algorithm looks at the data and tries to understand the behavior and characteristics of fans that churned in the past. Based on these patterns, the model can make a prediction for the fans that are currently having a season ticket. The outcome of the model provides a list of fans and their probability of churning. This information can be passed on to the marketing and sales department to act and make sure that the churner eventually will renew their season ticket at the Football Club.
This ‘churn’ case is applicable in a lot of different situations. Every company that has a subscription can apply machine learning to detect churners. A couple of other classification examples are:
- Detection fraud
- Spam detection
- Conversion prediction (buy or not)
- Face classification (unlock your smartphone with facial recognition)
Data Science Discovery Session
Curious how data science could help your organization? Fill in the contact form below for a free data science discovery session. Click here for more info.

FREE: Data Science Discovery Session
Are you curious about how data science can help your organization? During this free discovery session, we will take a look at your business' most potential use cases.
Thank you!
Related posts

Artificial Intelligence is ready!
In this interview, Jonathan Aardema talks with Prof. Eric Postma (professor of Cognitive Science and Artificial Intelligence at the University of Tilburg) about the why, how, and what of artificial intelligence applications. What do we see in practice, and what does science say about it?

Visiting London for the Tableau Partner Executive Kick-Off 2020
Every year Tableau invites its most valuable partners to kick off the new year together. The theme for this year was Accelerate, so let’s get right to the point. This exciting event was focused on three main areas.

Mastering DAX
Keeping your skills up to date is crucial when you work with the newest technology. At Rockfeather, we challenge each other to be the best version of yourself. That’s why I attended the mastering DAX course. DAX (Data Analysis Expressions) is a formula expression language. Next to Power BI, DAX is applied in Excel Power Pivot and tabular models in SQL Server. Learn it once, use it tomorrow.