
Automated reports with Power BI Report Builder
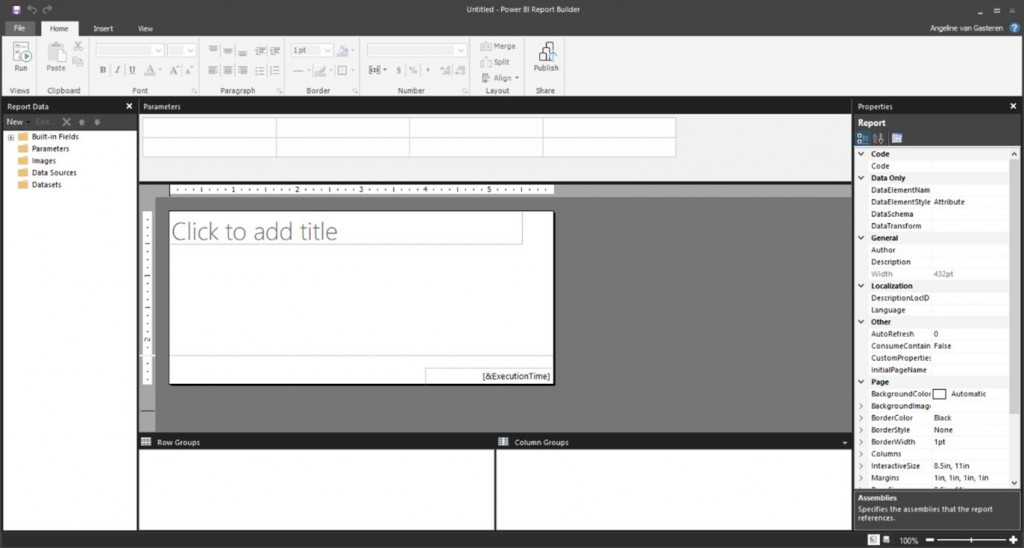
The fact that Power BI can be used to create dashboards is by now known to many organisations. However, many people do not know that there is a tool within Power BI that can help when there is a specific demand for (automated) PDF or Excel reports. This tool is called Power BI Report Builder. With Report Builder you can create paginated reports that can be formatted exactly as the developer wants them. This means that if data in a table is longer than one page, the table will continue on the next page. In Power BI, such a table will include a scroll bar that makes the page not suitable for sharing in PDF, as the information will not be fully readable for the reader.
PPU
Previously, Report Builder was only available to larger organisations that could afford Power BI Premium, but as of 2 April this has changed. It is now possible to purchase a Premium Per User (PPU) license which makes Report Builder available to the wider public. This license comes on top of the current Power BI Pro license. In this article, we will take a closer look at Power BI Report Builder to give you a better understanding of this tool.
Many similarities with SQL Server Reporting Services
Those who are familiar with SQL Server Reporting Services (SSRS) will see many similarities in Report Builder. The design is slightly different but most functionalities and options from SSRS can be found in Report Builder. When loading a data source, it is possible in Report Builder to choose a Power BI dataset. A Power BI dataset can be a dataset from a Power BI report that you have already created in Power BI Desktop. If you want to expand the dataset with a measure, you only have to do it in one place. The measure will then automatically become visible in Report Builder when the dataset is republished. This makes maintaining the reports a lot easier. In addition, you can publish the paginated reports to a Power BI Premium workspace with the push of a button.
Parameters as filters
Within Report Builder, a filter on the report is called a parameter. This parameter is often taken from one of the loaded datasets and can be used to filter the report. A commonly used parameter is month-year. This filters the report to a desired period. Another parameter that is often used is branches. When a company wants to send the same report to multiple branches, the parameter can help. In the parameter, the branch is chosen and the total report is filtered on that branch. This way, the report does not have to be duplicated. This saves time spent on the maintenance of the report.
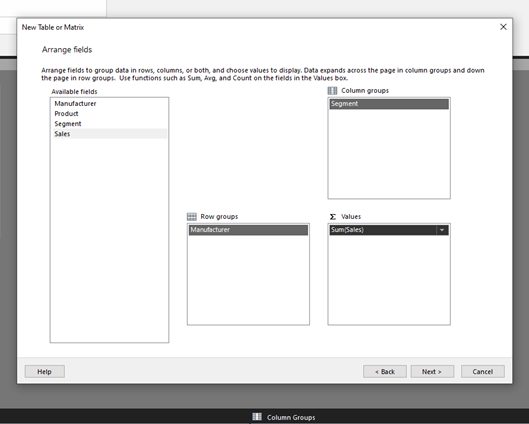
Build reports using the Table Wizard
A report can be built without technical knowledge using the table wizard. This wizard takes the user step by step through the creation of a table. The user only has to indicate which columns he/she wants to use from the dataset. The wizard then generates the table. For Excel users, this will feel very familiar. Pivot tables are created in a similar way.
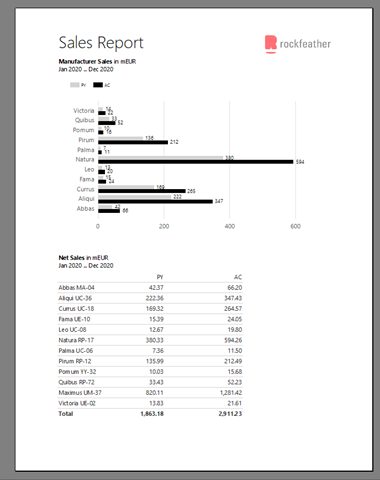
An example of a report that can be generated in Report Builder is the Sales Report below. This report goes to the management team every week so they can keep an eye on the numbers. This report is based on a Power BI dataset that is updated every night with the latest data. We can also create reports in Report Builder according to the IBCS standards. This provides better readability for the recipients of this report.
As mentioned briefly in the introduction, it is possible to export Report Builder files. The most common formats are PDF and Excel, but other formats such as Word, Power Point and XML are also available. By using Subscriptions in the Power BI service, the reports can be mailed to the right recipients. When the exports have to be sent to many different e-mail addresses, Power Automate can provide the solution. By adding the parameters of the report and the corresponding e-mail addresses to a table, the exports can be generated and sent automatically. In addition, Power Automate provides a dynamic solution that is easy to maintain.
Do you want to use Report Builder yourself or are you curious about all the possibilities? Then get in touch with us!
Latest Blog Posts

Artificial Intelligence is ready!
In this interview, Jonathan Aardema talks with Prof. Eric Postma (professor of Cognitive Science and Artificial Intelligence at the University of Tilburg) about the why, how, and what of artificial intelligence applications. What do we see in practice, and what does science say about it?

Visiting London for the Tableau Partner Executive Kick-Off 2020
Every year Tableau invites its most valuable partners to kick off the new year together. The theme for this year was Accelerate, so let’s get right to the point. This exciting event was focused on three main areas.

Mastering DAX
Keeping your skills up to date is crucial when you work with the newest technology. At Rockfeather, we challenge each other to be the best version of yourself. That’s why I attended the mastering DAX course. DAX (Data Analysis Expressions) is a formula expression language. Next to Power BI, DAX is applied in Excel Power Pivot and tabular models in SQL Server. Learn it once, use it tomorrow.