Databricks for Data Science
Picture this: your business is booming, and you need to make informed decisions quickly to stay ahead of the competition. But forecasting can be a tedious and time-consuming process, leaving you with less time to focus on what’s important. That's where Azure Databricks comes in! We used this powerful technology to automate our internal forecasting process and save precious time. In this blog post, we'll show you the steps we took to streamline our workflow and make better decisions with confidence. So make yourself a coffee and enjoy the read!
Initial Setup
Before we dive into the nitty-gritty of coding with Databricks, there are a few important setup steps to take.
First, we created a repository on Azure DevOps, where we could easily track and assign tasks to team members, make comments on specific items, and link them to our Git commits. This helped us stay organized and focused on our project goals.
Next, we set up a new resource group on Azure with three resources: Azure Databricks Services, a blob storage account, and a key vault. Although we already have clean data in our Rockfeather Database (thanks to our meticulous data engineers), we wanted to keep our intermediate files separately in this resource group to ensure version control and maintain a clean workflow. Within our blob storage, we created containers to store our formatted historical actuals, exogenous features, and predictions.
Finally, we sketched out a high-level project architecture to get a bird’s-eye view of the project. This helped us align on our deliverables and encouraged discussion within the team about what a realistic outcome would look like. By taking these initial setup steps, we were able to hit the ground running with Databricks and tackle our forecasting process with confidence.
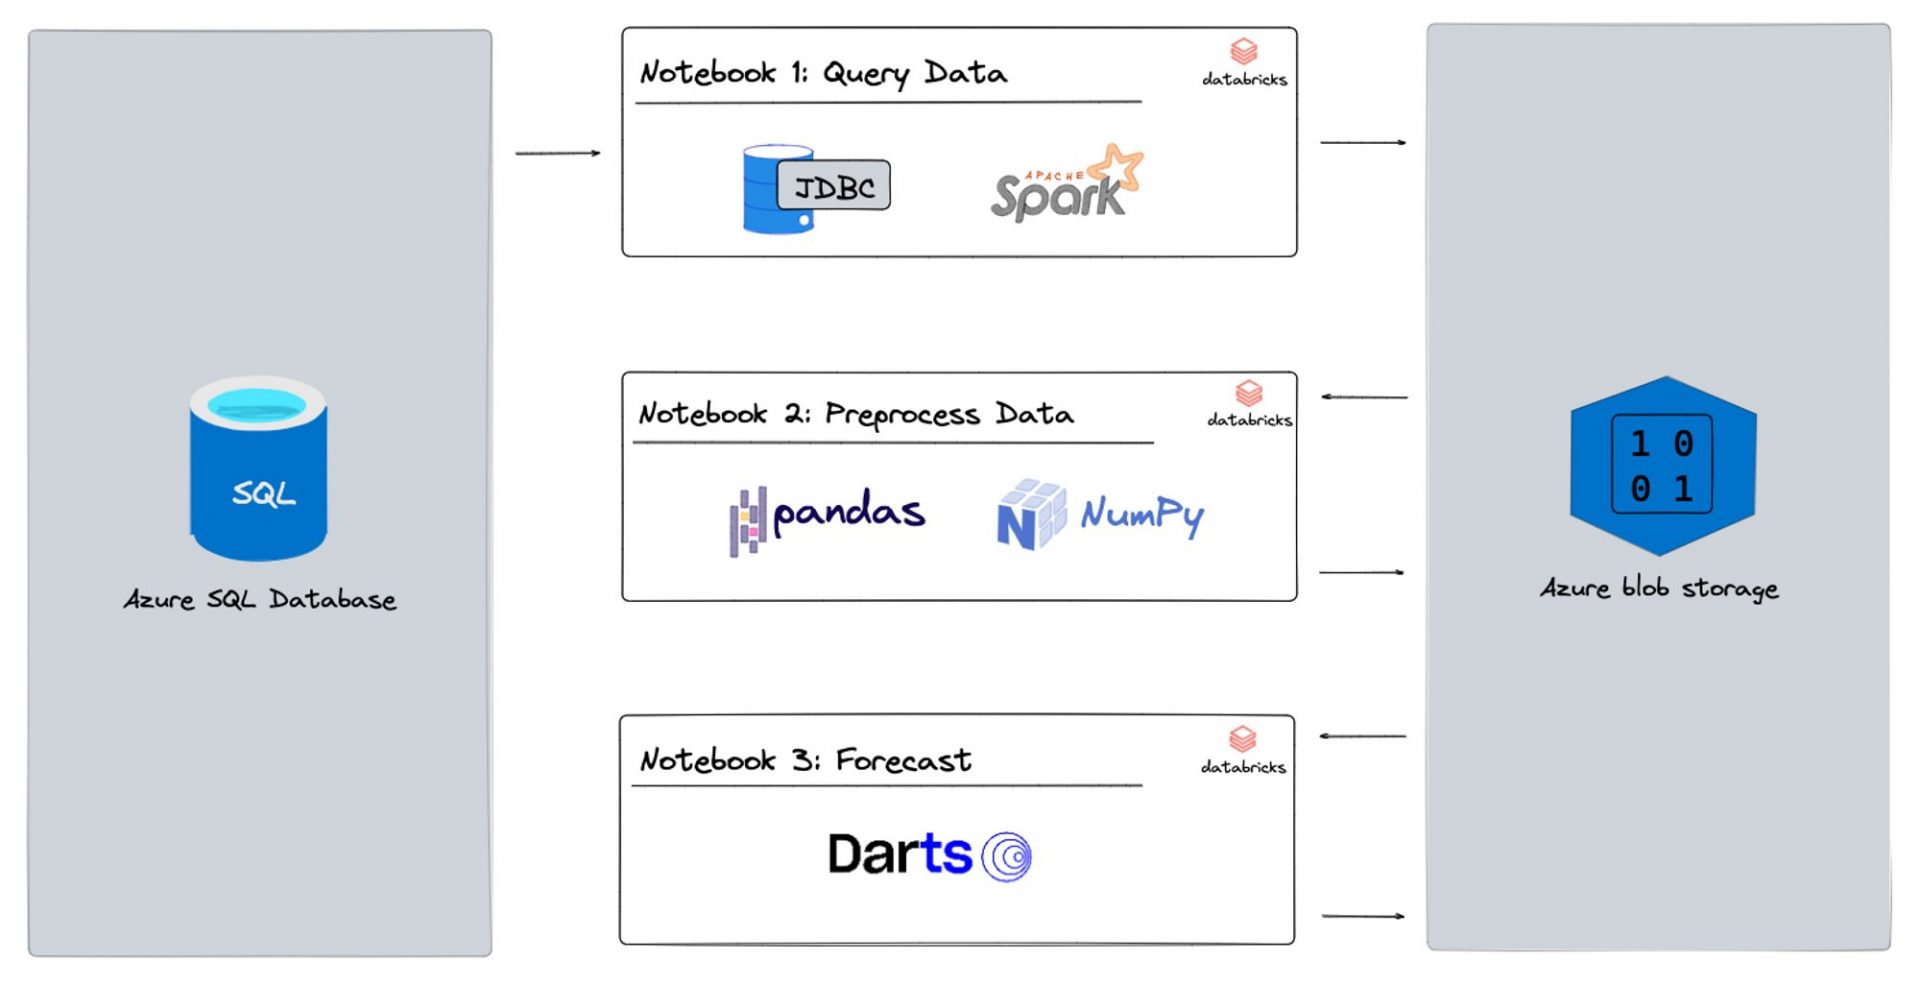
Project Architecture
Moving on to Databricks
Setting up Azure Databricks
Now we’re ready to dive into Databricks and its sleek interface. But before we start coding, there are a few more setup steps to take.
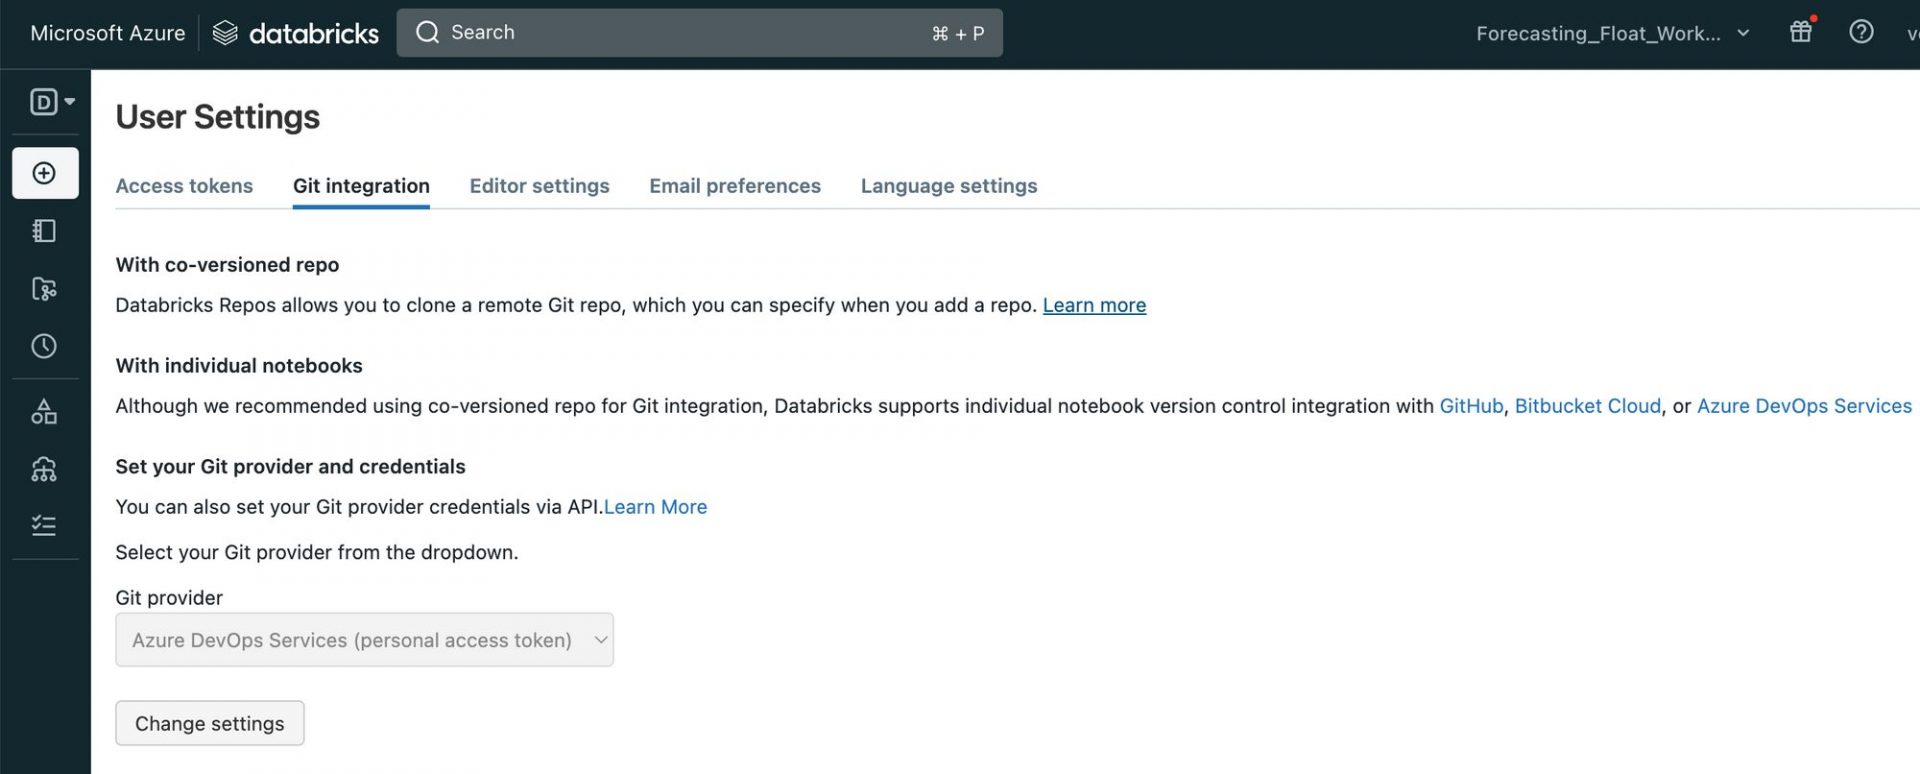
First, we want to link the Azure DevOps repo we set up earlier to Databricks. Kudos to Azure Databricks, the integration between these two tools is seamless! To link the repo, we simply go to User Settings > Git Integration and drop the repo link there. For more information, check out this link.
To keep our database and blob storage keys and passwords secure, we use the key vault to store our secrets, which we link to Databricks. You can read more about that here!
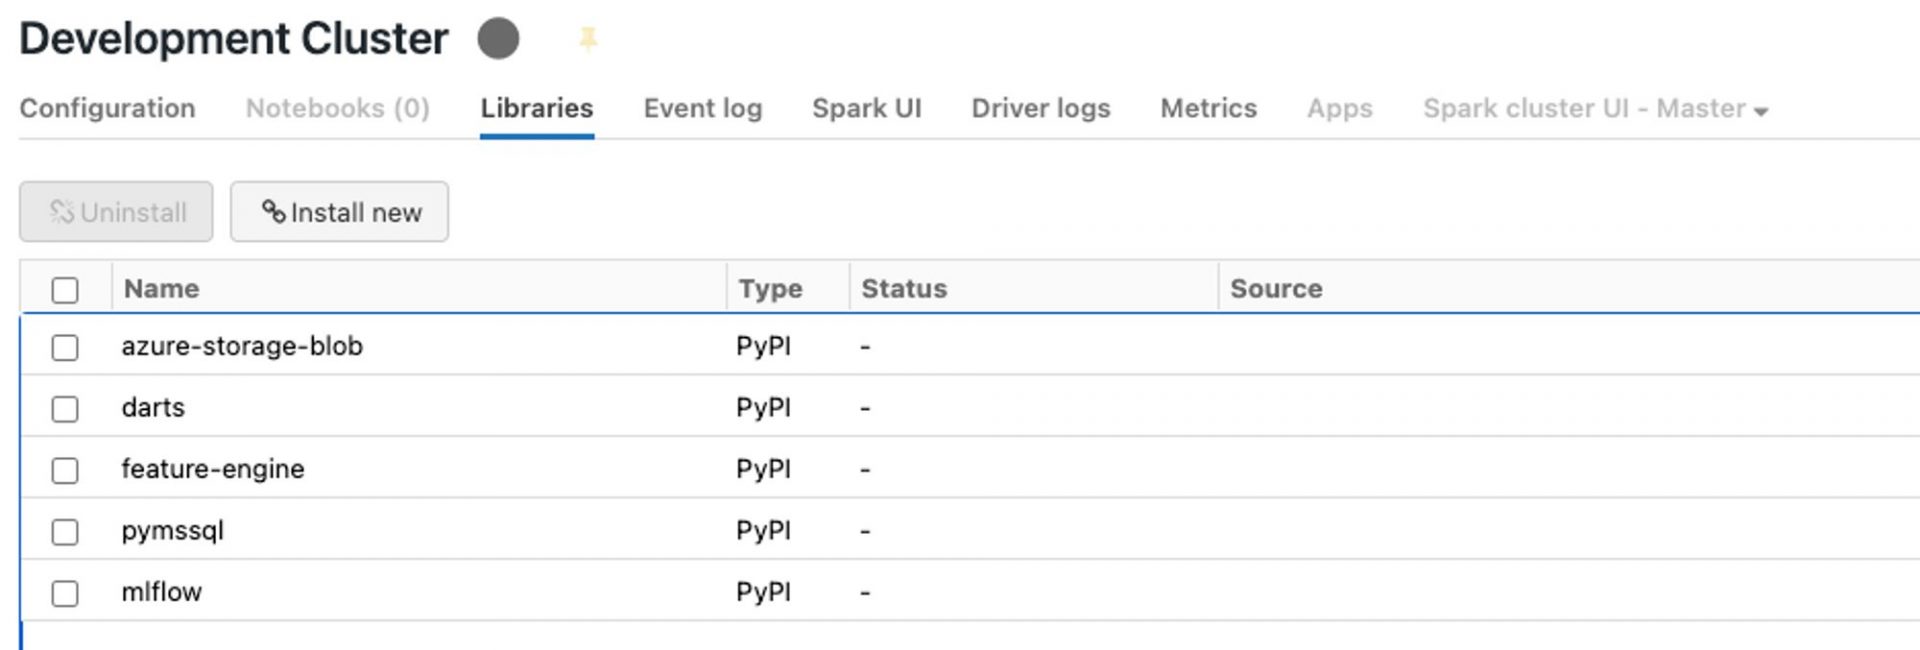
Lastly, we need to create a compute resource that will run our code. Unlike Azure Machine Learning, Databricks doesn’t have compute instances, only clusters. While this means it takes a minute to spin up the cluster, we don’t have to worry about forgetting to terminate it since it automatically does so after a pre-defined time period of inactivity! It’s also super easy to install libraries on our compute: just head over to the Libraries tab and click on “⛓️ Install new”!
From Database Query to Forecast
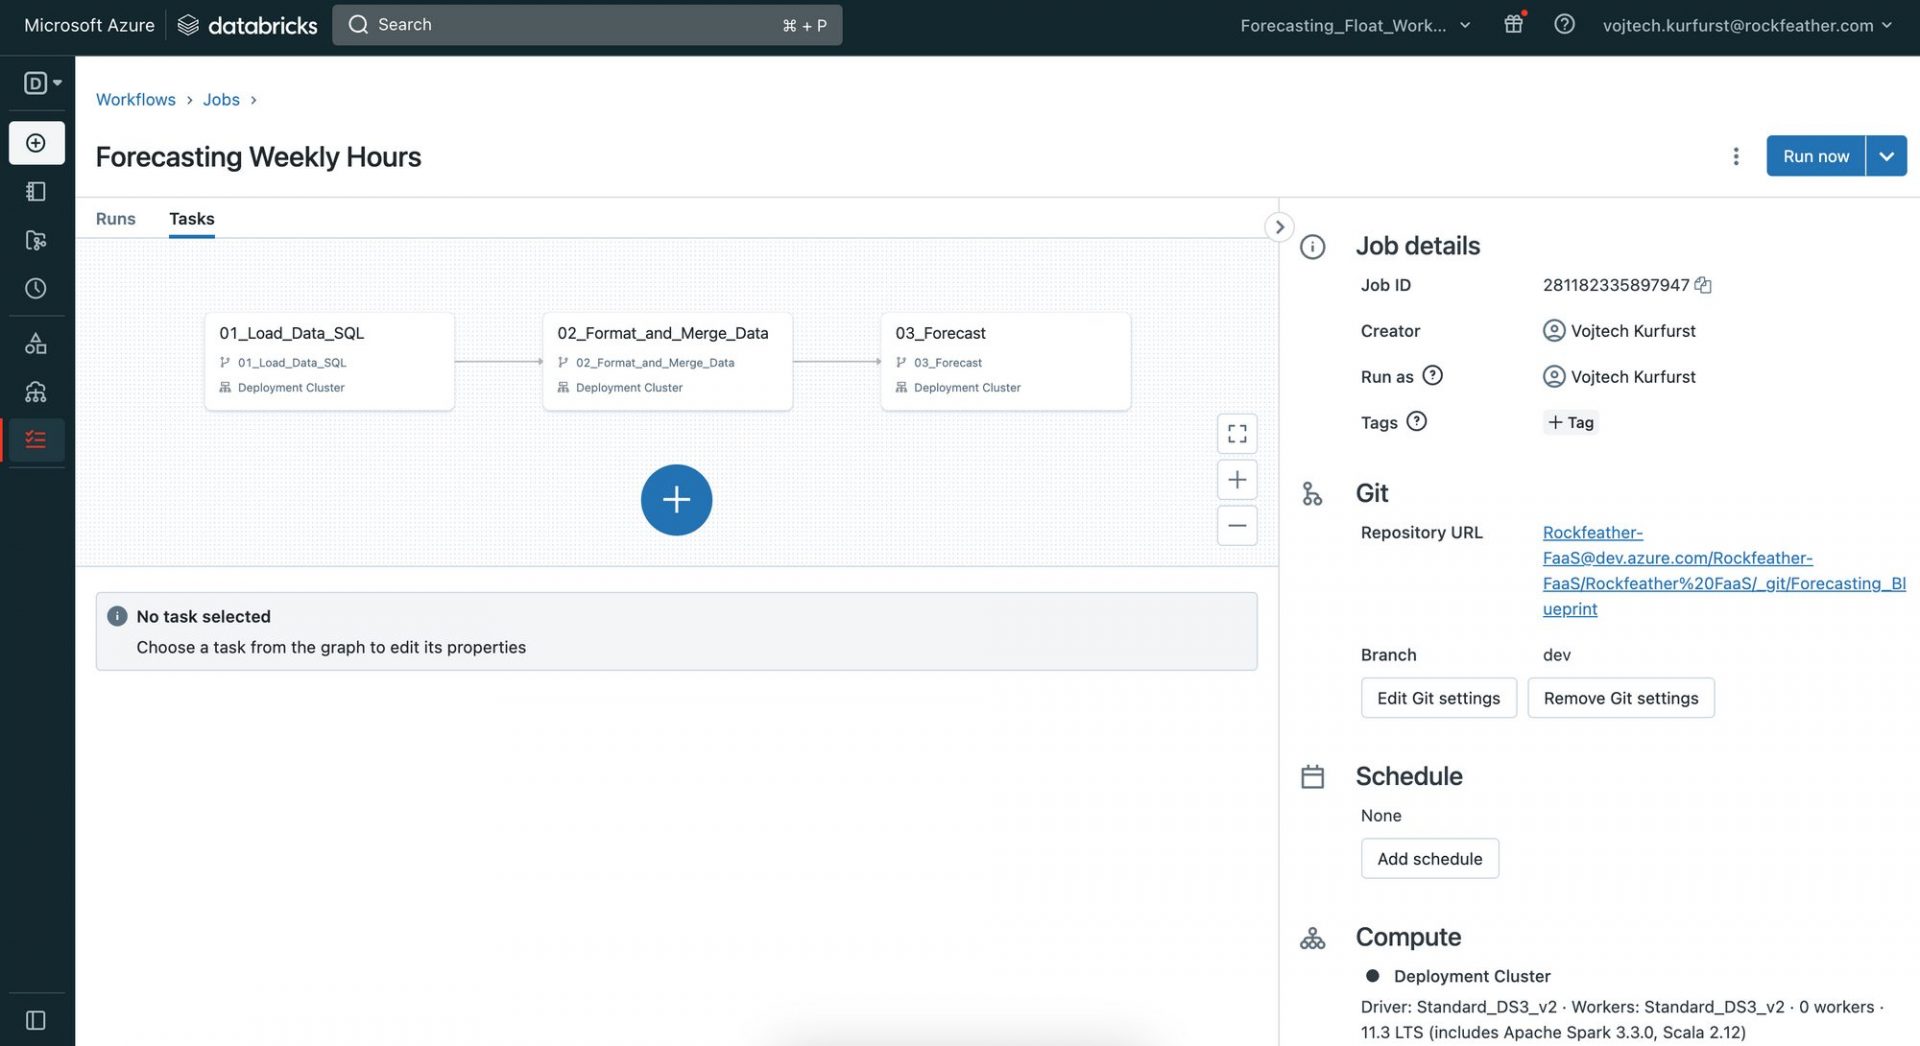
Now that our setup is complete, we move on to using Databricks notebooks for data loading, data engineering, and forecasting. We break this down into three sub-sections:
- Query Data: We create a notebook which reads the formatted data from the blob storage containers we created earlier. We then transform this data and create data frames for further data engineering.
- Preprocess Data: Here, we perform data cleaning, feature engineering, and data aggregation on our data frames to get them into a shape suitable for forecasting. This is also the place to apply transformations such as normalisation, scaling, and one-hot encoding to prepare our data for modelling.
- Forecast: We use machine learning models such as Random Forest, Gradient Boosting, and Time Series models to forecast future values based on our prepared data. For our baseline model, we use the classic Exponential Smoothing model. We then store these predictions back in our blob storage for further analysis and visualisation.
By breaking down the process into these three sub-sections, we can work more efficiently and focus on specific tasks without getting overwhelmed. As shown in the Project Architecture above, each step is one notebook. Let’s have a closer look at each notebook.
Notebook 1: Query Data
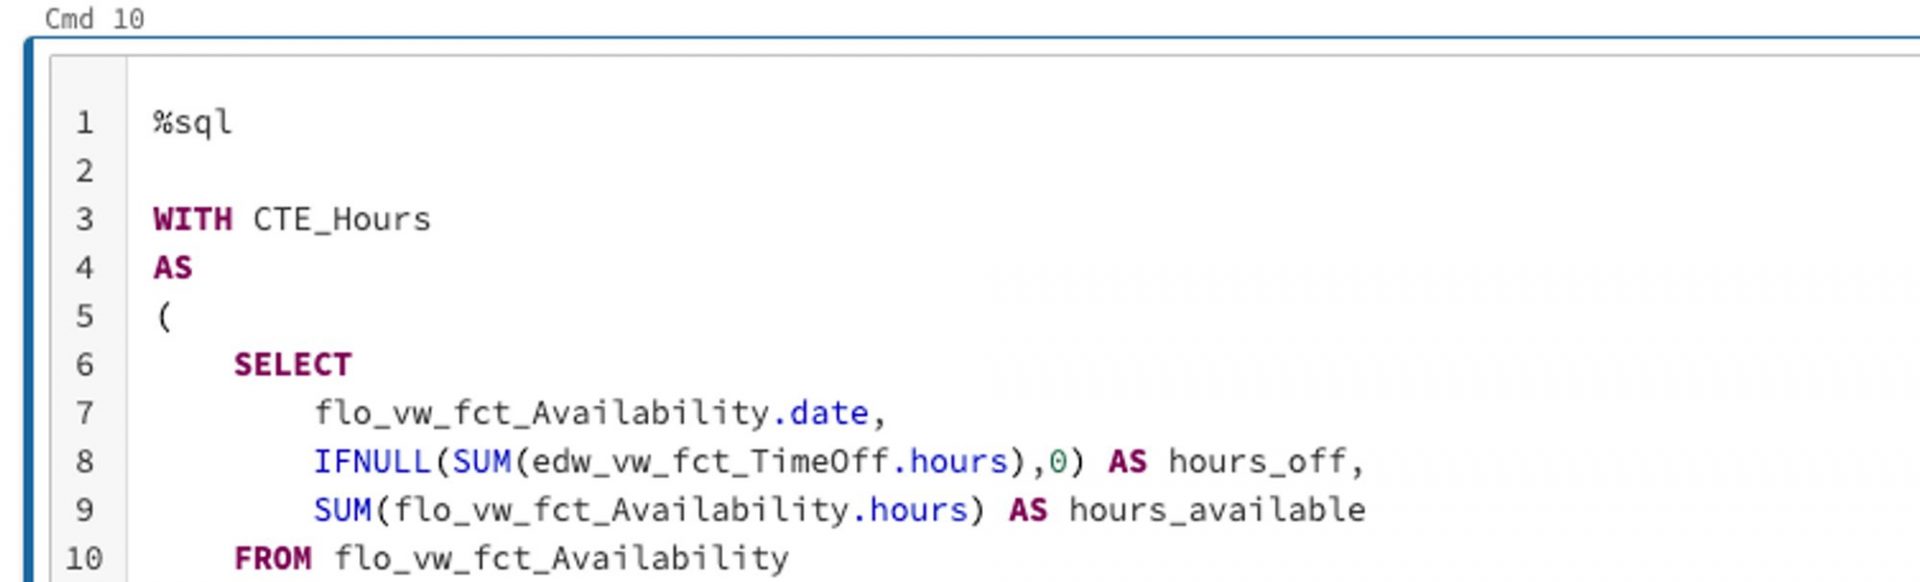
The code we’ll be writing in Databricks is pretty much in standard notebook format, which is familiar territory to all data scientists. Our data engineers in the audience will also appreciate that we can write, for example, SQL code in the notebook. All we have to do is include the %sql magic command (link: https://docs.databricks.com/notebooks/notebooks-code.html) at the beginning of the cell, as shown below. We use this approach for our first notebook, where we query the data we need. In our case here, it’s past billable hours and the available hours of our lovely consultants. Once we have the data we need, aggregated to the right level, we save it in our blob storage for the next step.
Notebook 2: Preprocess data
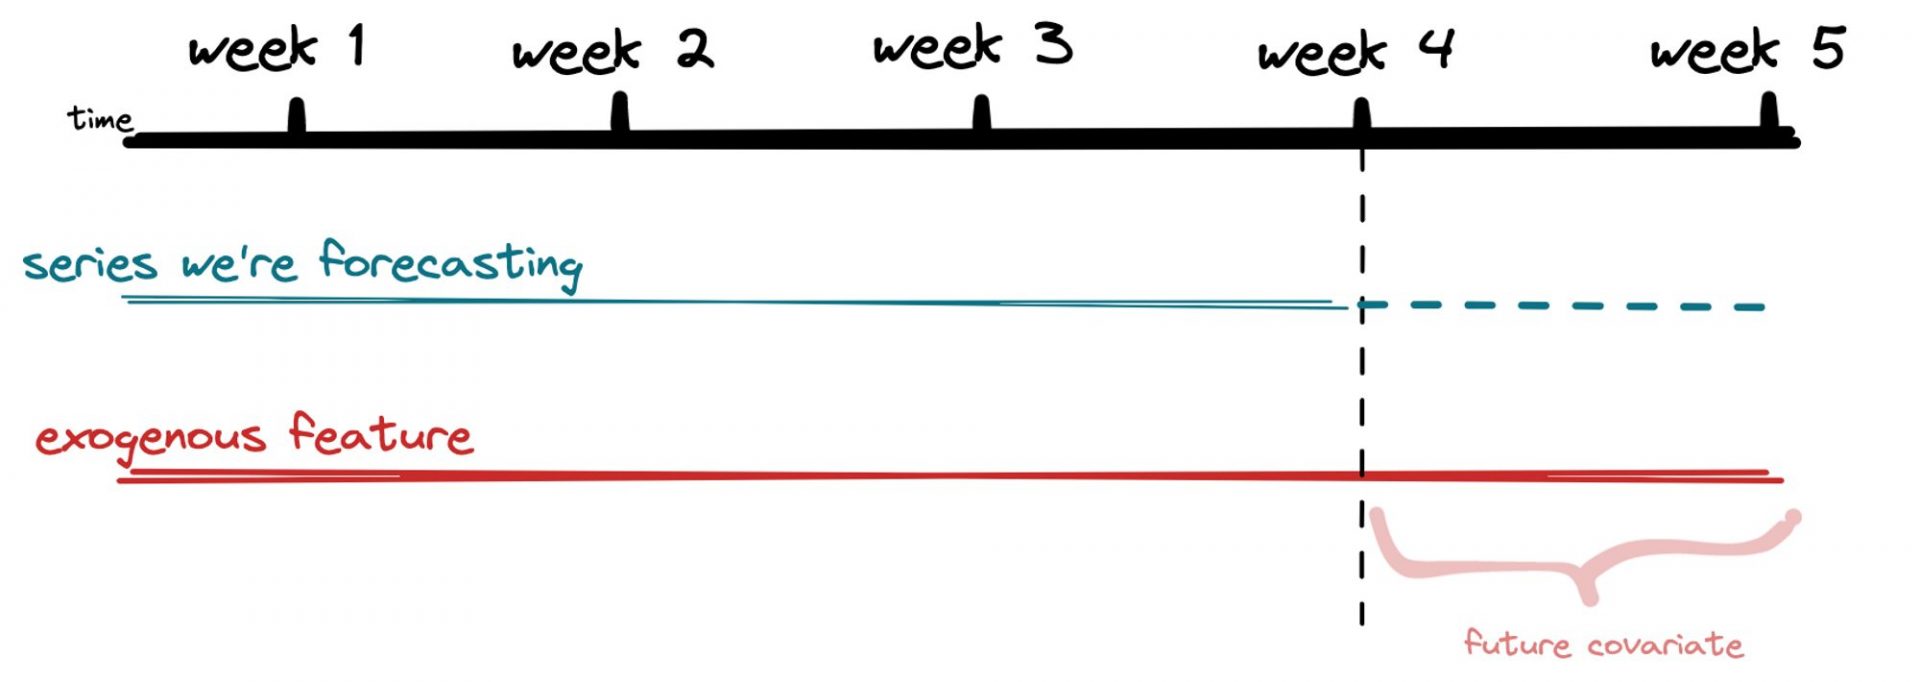
In Notebook 2, we use pandas and numpy to preprocess our data and do our feature engineering. We need to make sure we have all the data on the features we’ve identified for the whole forecast period before we start training any models. For example, if we’re forecasting billable hours and using total available hours of our consultants as an exogenous feature, we need to have that data available for the entire forecast period. While this may seem obvious in this case, it’s an important step to take before we jump into any modelling! Once we’ve got our data formatted the way we want it, we save it back to blob storage and move on to the next notebook.
Notebook 3: Forecast
Here’s where the magic happens – we finally get to do some forecasting! We use the darts package to train multiple models and compete against our baseline Exponential Smoothing Model. We love this package because it’s super easy to use and makes backtesting a breeze. To evaluate model accuracy, we use the mean absolute percentage error (MAPE) – it’s a simple metric that’s easy to understand.
We try out different models like linear regression, random forest, and XGBoost and compare their performance against our baseline. Our baseline model had an MAPE of 44%, which isn’t great, but we’re not deterred. By adding in our single exogenous feature and leveraging our three ML models, we were able to decrease our MAPE to 12% – a huge improvement! And of course, we save our results back to blob storage for future reference.
With our forecasting pipeline up and running in Databricks, we can sit back and watch the predictions roll in. It’s amazing what you can do with a little data and a lot of creativity!
💡 Forecast backtesting is a method used to check how accurate a forecast is by comparing its predictions with what actually happened. This helps identify any errors or biases in the forecasting model, which can be used to improve future predictions. It’s a useful tool in many industries, such as finance or weather forecasting, and helps decision-makers make better-informed decisions.
Our thoughts on Databricks
We have got to give props to Databricks, it’s a tool that makes our lives easier. It’s like having a Swiss army knife in your pocket – it’s slim, versatile, and gets the job done. We love the collaboration feature – we can code with our team, and it’s like a real-time jam session. Plus, setting up and scheduling pipelines is as smooth as butter. The best part is the seamless integration with mlflow and PySpark – it’s like having your favorite sauce on your favorite dish. Let’s just say that Databricks has been a game-changer for us, and we’re excited to see what new features they’ll cook up in the future!
Next Steps
Although we’ve got a pipeline set up, our forecasting journey still has an exciting ride ahead. That’s always how it is with data science projects. The next step is generating maximum value from our forecasts.
We are discussing with our Data Viz team how best to integrate this forecast into our dashboards. Also, we’re scheduling meetings with our CFO to see how exactly we can make his job easier by, for example, introducing more exogenous features or reporting historical accuracy.
As a data-thinking organization, we’re committed to becoming more anti-fragile, and we treat our customers the same way. This means building resilience into our forecasting models to ensure they can withstand unexpected events and continue providing reliable forecasts. If you found this post inspiring and would like to know more, don’t hesitate to reach out!