Where Solid Ideas,
Take Flight

Welcome to Rockfeather!
At Rockfeather, we’re not just consultants; we’re dream builders. We turn your Data & Automation vision into reality, using the power of technology to bring your ideas to new heights. Working hand-in-hand with you, we empower you to achieve your goals. Ready to see your solid ideas take flight? Partner with Rockfeather today, and let’s start a journey of innovation and success. Together, there’s no limit to what we can achieve.
Solid Ideas
Have an idea you want to make a reality? We’re here to help your Solid Ideas take flight using automation, insights, development, and strategy. Whether it’s your concept for smarter data automation, enhancing data maturity, generating actionable insights, or ensuring data integrity, we work alongside you to create lasting impact. Click on one of our Solid Ideas to see how we can elevate your organization together.
Data Automation
By integrating advanced automation solutions, your business can achieve greater productivity, reduce errors, and improve safety. Pretty Solid Idea, right?
Data Driven Insights
Data-driven insights help businesses extract valuable insights from the vast amount of information available. As Solid as an Idea can get.
Data Maturity
Companies that invest in their data maturity are better able to respond to market changes, discover new opportunities, and achieve sustainable growth. Sounds like a Solid Idea.
One Source of Truth
By embracing ‘One Source of the Truth,’ you give your team the clarity and confidence they need to achieve their goals. A Solid Idea at its finest.
Skill Development
Strong levers for developing the right skills for you and your colleagues. Of course that’s a Solid Idea.
Cases & Solutions

Empowering Nutricia through Power BI coaching
As part of Danone, Nutricia believes that employees should be empowered to be able to work with data independently. However, several teams within the Nutricia factory in Zoetermeer had questions about Power BI dashboarding. Unfortunately, the digital team also lacked the necessary knowledge to answer these questions. We set up a training & coaching program together with Nutricia that helps end-users to get more out of their Power BI reporting. Read below what we did to empower Nutricia’s teams.

Turning Raw Data into Delicious Insights
As a well-known maker of various appetizers, Signature Foods made analyses based on various decentralized data sources inside Excel. It was then important to harmonize and visualize the data from these sources. Rockfeather helped Signature Foods implement Power BI in combination with Zebra BI to visualize information effectively, introduced the IBCS®, and workflows were automated with Power Automate.
Blog

Webinar: Planning in Power BI
Are you ready to start planning more efficiently? During this webinar, we discuss Acterys, a xP&A solution that utilizes the power of AI with the visualization possibilities of Power BI.
Why PowerApps is a great Excel replacement
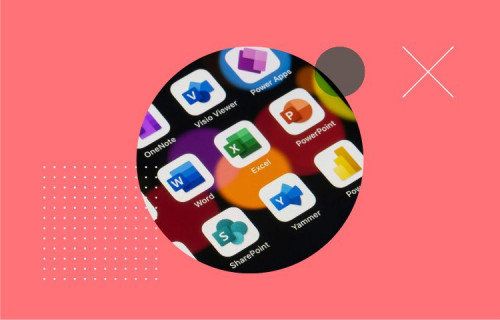
In this blog, we are looking at a common scenario in the world of data: Microsoft Excel versus PowerApps. PowerApps offers a great alternative to our traditional spreadsheets. We will explore why it sometimes might be a clever idea to switch from your familiar spreadsheets to the new world of PowerApps.

TimeXtender or Microsoft: which fits your organization better?
When it comes to data management, there are tons of solutions in the market. This makes the choice of the right fit in your organization a challenge. In this blog, we compare and contrast the two most used stacks in the Netherlands right now; the Microsoft Stack and Timextender.