Visiting London for the Tableau Partner Executive Kick-Off 2020
- Platform positioning (Tableau & Salesforce)
- Blueprint
- Product roadmap 2020
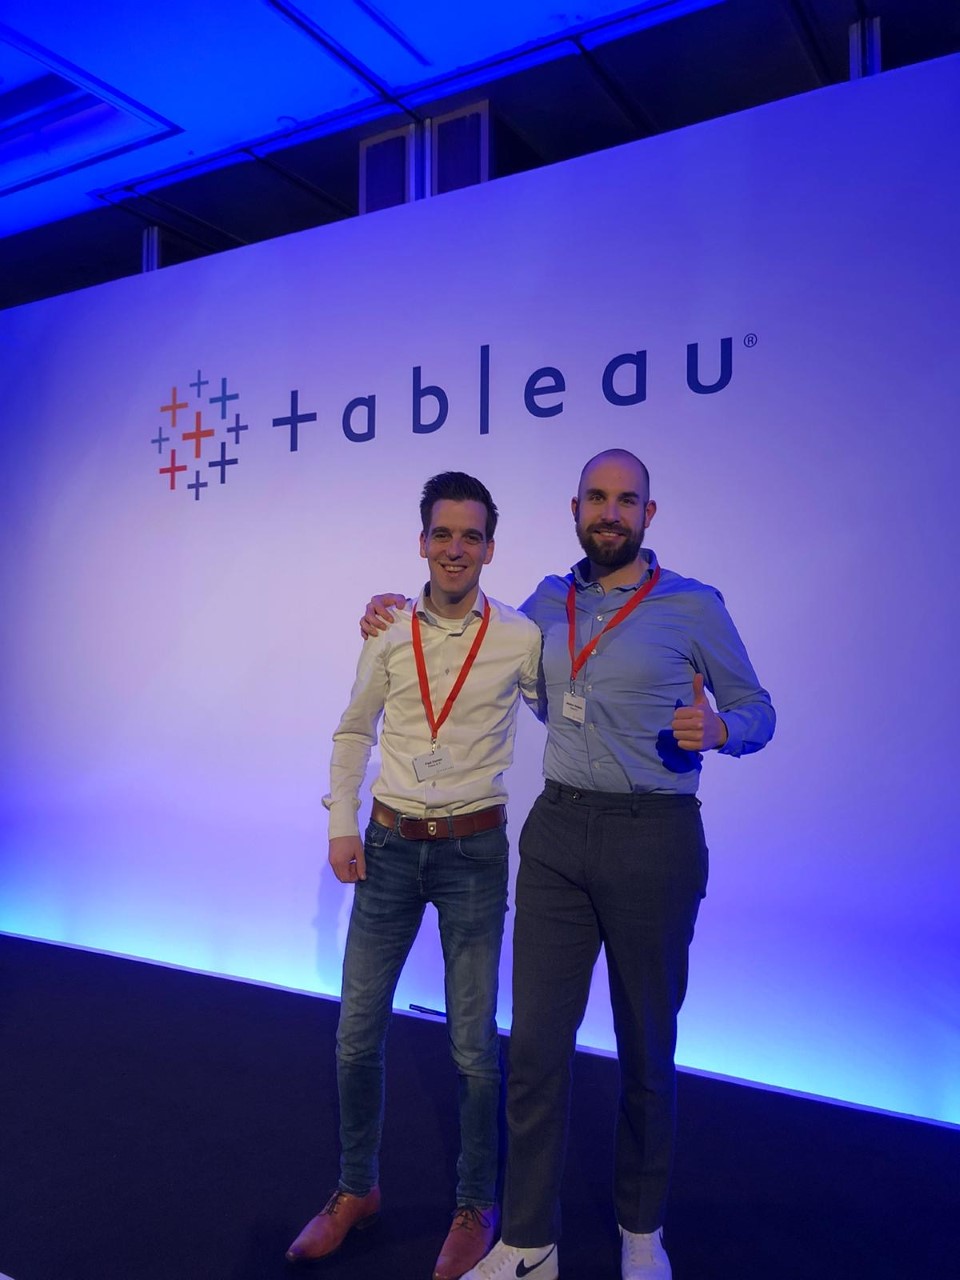
Every year Tableau invites its most valuable partners to kick off the new year together. The theme for this year was Accelerate, so let’s get right to the point. This exciting event was focused on three main areas:
- Platform positioning (Tableau & Salesforce)
- Blueprint
- Product roadmap 2020
On top of the inspiration sessions, presentations and live demos, it’s always a thrill to share our passion for data with like-minded people to exchange best-practices and drinks.
No shit, Einstein!
For most of you in the data & analytics field, it has not been a surprise that in 2019 Salesforce acquired Tableau for a whooping amount of 15.7 billion dollars. Everybody in the audience was eager to know what would be the plan of attack to marry up these two software giants. As in real life, high expectations are often accompanied by disappointments. Tableau mentioned that Tableau and Salesforce are (still) working through what the long-term product roadmap will look like. A wise man (Einstein) once said: “The most beautiful experience we can have is the mysterious.” That is precisely the current status of the strategy for Salesforce and Tableau. It’s mysterious. However, Salesforce, Tableau, and Einstein Analytics will continue to be supported and developed.
Salesforce, Tableau and Einstein Analytics in the mix
Salesforce is undoubtedly the #1 platform in the world with massive amounts of sales and customer data used as fuel for Einstein Analytics. Einstein Analytics allows you to explore all of your data quickly and easily by providing AI-powered analytics, right in Salesforce. On the other hand, Tableau has been a leader in the Gartner of Analytics and BI platforms for over seven years. It’s easy to see how these tools will ultimately come together over time.
The short term efforts are focused on integrating Salesforce data even more seamlessly into Tableau by enhancing the current Salesforce connectors. Subsequently, some of the Einstein Analytics functionalities will be available to pump back into Tableau. As always, the future looks promising, especially for those that are already enjoying Salesforce and/or Tableau, and want to grow in their data maturity level even more by topping it off with Einstein Analytics.
Tableau Blueprint
During our stay in London, we have received additional information and exchanged best practices regarding the Tableau Blueprint. Tableau Blueprint is a step-by-step manual to becoming a data-driven organization. No matter the data maturity of your company, the use of data always needs to be broadened, deepened and scaled. Transforming how your company makes decisions every day is a daunting task. However, incorporating data and analytics into decision-making processes is how you will make the most impact on your organization.
Achieving that level of transformation requires a holistic approach to developing your analytics practice. Although every organization’s data journey will differ, Tableau Blueprint outlines the processes and best practices from numerous customers.
This masterclass gave us lots of energy and confirmation of our project approach to help organizations with improved decision making instead of just creating visually appealing dashboards. Therefore we can highly advise you to start experimenting with the Blueprint together with your data champions.
Product roadmap
Without further ado, we bring to you the innovations that lay ahead in 2020. Below you will find the most promising features:
- Self-Service Analytics
- Animations and dynamic parameters (excellent!)
- Augmented Analytics
- Ask data (custom suggestion)
- Explain data usability improvements (handy!)
- Data Management
- Salesforce connector update to latest APIs
- Visual LODs
- Prep – Write to the database and Incremental refresh (Whoop Whoop)
- Mobile
- Metrics overview
- Server
- Single node containes
- SAN support for backups
- Online
- Cloud standard. Tableau is mainly used as a desktop product, but in the future, we will see that more and more functionalities will become available in the cloud. This has two main advantages 1) always using the latest version and 2) better performance
- Licensing
- Login based License Management (Score!)
- Einstein Analytics
-
- Predictions in Tableau
- Pre-built Predictive use cases for all industries
If you want to know more, please make sure to check out our latest Tableau content!

Artificial Intelligence is ready!
In this interview, Jonathan Aardema talks with Prof. Eric Postma (professor of Cognitive Science and Artificial Intelligence at the University of Tilburg) about the why, how, and what of artificial intelligence applications. What do we see in practice, and what does science say about it?

How old-fashioned corporate technology kills sustainable ambitions
Creating sustainable businesses is definitely one of the biggest challenges for big corporations. The ‘why’ in this story is clear as daylight, it is the ‘how’ and ‘what’ that is nagging them.

Mastering DAX
Keeping your skills up to date is crucial when you work with the newest technology. At Rockfeather, we challenge each other to be the best version of yourself. That’s why I attended the mastering DAX course. DAX (Data Analysis Expressions) is a formula expression language. Next to Power BI, DAX is applied in Excel Power Pivot and tabular models in SQL Server. Learn it once, use it tomorrow.

