Speed Up Exploratory Data Analytics - Leveraging R in Power BI
Did you know that you can use the R programming language inside Power BI? By doing so, you can significantly enhance the exploratory capabilities for your data-loving audience. In this blog, we give a first impression. In our advanced Power BI training mid-September, we will go in more detail.
What is R?
Firstly, let’s start off with a short introduction about R. R is a popular open-source programming language and software environment for statistical computing and graphics. In 1993 the programming language was designed by Ross Ihaka and Robert Gentleman at the University of Auckland in New Zealand. Both developer’s first names start with R, that’s where the programming language’s name originates from. The language is used by data scientists, programmers, and statisticians from anywhere in the world.
What’s in it for me?
Furthermore, If you’re an R user, your first thoughts are: “I can use numerous packages in R to visualize my data just the way I want. So why do I need Power BI?” You’re right! However, R mainly produces static visualizations, and sharing your visuals can be quite tedious. With the use of Power BI, you can import your R visuals into the PowerBI report and from there slice and dice the data any way you want. By using this combination, you save significant time writing code for different visuals.
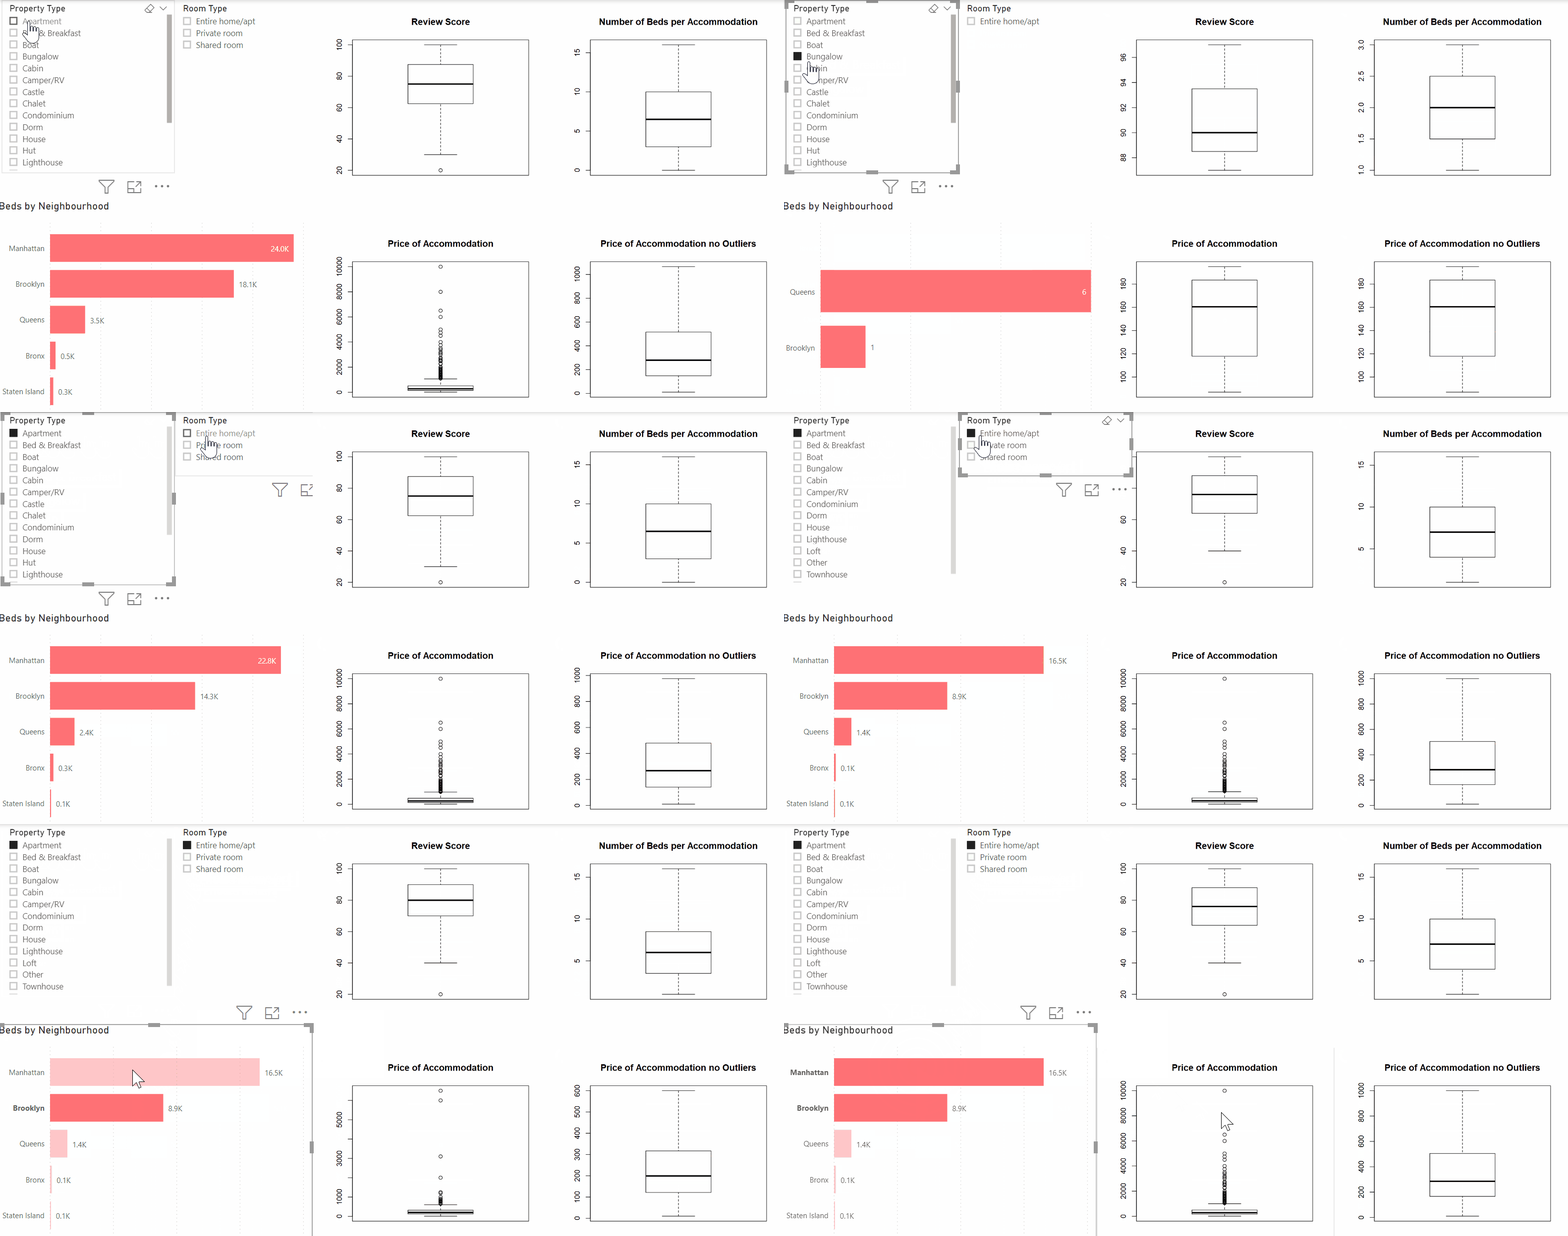
For example, In the dashboard below, you see the powerful combination between Power BI and R in practice. The dashboard consists of multiple Power BI visuals as well as four box plots that were created in R. As you can see, the dashboard remains dynamic and excellent for exploratory purposes. In this example, you are providing your data audience with deeper insights while maintaining the flexibility of Power BI.

But why use R in the first place?
Generally, R provides many benefits when analyzing your data. Firstly, it introduces the world of statistics to your data analyzes. Being unable to perform sophisticated statistical analyzes and predictive analytics such as linear and nonlinear modeling, statistical tests, time-series analysis, classification, clustering is a thing of the past! Subsequently, it doesn’t stop here, because the world of open-source software is now at your fingertips when leveraging R. Overall, There are over 900 R packages available for use in the Power BI with new packages being added regularly. So there is an analytical package for almost any use case.
So what’s next?
Hopefully, I inspired you to start your analytics journey with R. You’ll be surprised which insights you can uncover using this powerful combination. If you want to get started with leveraging R inside PowerBI, be sure to check out the Power BI R Script Showcase and Microsoft’s R in Power BI Documentation to get a head start!
Piqued your interest? Want to know more about performing advanced data analysis using Power BI? Join our Power BI Advanced training!

Gartner Magic Quadrant for Business Intelligence Platforms and Analytics 2020
The Gartner Magic Quadrant for Business Intelligence is a piece of analyst reporting we look forward to every year. Both the dept and the scope of this research makes it worth the read. But not many people take the time to really dig into the details of the report.

Mastering DAX
Keeping your skills up to date is crucial when you work with the newest technology. At Rockfeather, we challenge each other to be the best version of yourself. That’s why I attended the mastering DAX course. DAX (Data Analysis Expressions) is a formula expression language. Next to Power BI, DAX is applied in Excel Power Pivot and tabular models in SQL Server. Learn it once, use it tomorrow.
The Best Data Science Webinars
Day to day hectic is always the enemy of your ambition to acquire new skills and gain knowledge in the fields you identified. These special times offer the opportunity for some of us to spend some extra time to invest in yourself to learn new things. For those of you who have the ambition to learn more about data science we made a selection of the webinars from the people at Alteryx to learn more about this subject.