
Microsoft Fabric Masterclass
Microsoft Fabric is a new tool from Microsoft that integrates existing components in the areas of Data Science, Data Engineering, and Data Visualization. This speeds up your business process and ensures that you don't have time-consuming jobs writing data from one component to another. During this online Master Class, we explain how this works.
Microsoft Fabric combines new and existing Power BI, Azure Synapse, and Azure Data Factory components into one integrated environment. Whether you are already an existing user of one or more of these products or completely new to the Microsoft suite, Microsoft Fabric offers a refreshed user experience with many benefits.
The most significant advantage is that the integrations of the different products are brought to a new level. Furthermore, the user is increasingly guided and assisted with integrations and analyses. Microsoft calls this addition of AI to the product Copilot, although Microsoft still has to release this feature.
Would you like to know all the benefits of Microsoft Fabric in an hour and how you, as an organization, can get the most out of this new direction from Microsoft? Fill out the form below to watch our free Online Masterclass. Would you rather read about Fabric? Please read our blog here.
What do you learn during this webinar?
During this master class, experts will bring you up to speed on Microsoft Fabric and how this tool integrates different applications together. In the master class, we will dive into the following areas of expertise:
- Data Science
- Data Engineering
- Data Visualization
To whom is this of interest?
This Masterclass is of interest to people who might want to start working with the Microsoft suite or people who work with tools in the Microsoft Suite such as:
- Power BI
- Azure Synapse
- Azure Data Factory
Fill out this form to watch the Fabric Masterclass
You can now watch the webinar!

Microsoft Fabric or TimeXtender
When it comes to data management, there are tons of solutions in the market. This makes the choice of the right fit in your organization a challenge. In this webinar, we compare and contrast the two most used stacks in the Netherlands right now; the Microsoft Stack and Timextender.
Although Microsoft Fabric and TimeXtender are very similar to each other, there are some very important differences. Knowing these distinctions between the two tools is important in picking the best combination of tools for your business.
During this webinar, our experts will dive into both Microsoft Fabric and TimeXtender and analyze, compare, and contrast the two platforms.
What will you learn during this webinar?
During this webinar, our experts will try and answer the following questions:
- What are the strong parts of the Microsoft Stack and TimeXtender
- How are the Microsoft Stack and TimeXtender different?
- How can the Microsoft Stack and TimeXtender be combined?
To whom is this of interest?
This webinar is for everyone that is looking for a data engineering solution or is already working with a data engineering solution, such as:
- IT and BI managers
- Data Analysts
- Data Engineers
You can now rewatch the webinar!

Optimizing the O2C process with Process Mining
Learn how to optimize your O2C process with Process Mining. In this webinar, we'll explain in detail how the tool Process.Science collects and analyzes data from various sources and creates a clear visual overview that helps you identify different bottlenecks.
Are you having difficulty gaining insights into your Order-to-Cash (O2C) process? And does that lead to difficulties in focussing in on your business’ long term strategy, or even a decrease in quality of your service? Process Mining collects and analyzes data from various sources and creates a clear visual overview that helps you identify different bottlenecks. Using Process Mining, you will gain greater insight into your O2C process, which allows you to decrease your Days Sales Outstanding (DSO), increase customer satisfaction, and lower your operational costs.
What is Process Mining?
Process mining is a data analysis technique that aims to discover, monitor, and improve real processes by extracting knowledge from event logs, which record the execution of processes in information systems.
By analyzing event logs, process mining can provide insights into how processes are executed, including how often specific paths are taken, which activities are taking longer than expected, where bottlenecks occur, and where errors are happening. These insights can be used to optimize processes, identify opportunities for automation or improvement, and monitor ongoing performance.
What will you learn in this webinar?
With the help of in-depth explanation by our experts combined with a hands-on demo of Process mining in Process.Science, this webinar will answer the questions:
- What is Process Mining?
- How can Process Mining optimize your O2C process?
- How Process Mining reduces operational costs and improves customer experience.
To whom is this webinar interesting?
This webinar is for everyone that is interested in Process Mining, such as:
- IT & BI managers
- Power BI and Power Apps end-users
- Data Analysts
- Business Controllers
Watch this webinar

Webinar: Advanced forecasting with data science
Forecasting with Data Science can help your organization take the next step in data maturity. In this webinar, we'll show you how to get even more out of your forecasts with AI.
Forecasting with Data Science can help your organization take the next step in data maturity. What would it mean to you as a financial person if your forecasts became much more accurate? Would your management team be helped by more insight into the impact of developments in these turbulent times? By using Artificial Intelligence (AI), you can create forecasts that can track an unprecedented number of parameters. Moreover, these forecasts can be redefined at any time, and you don’t need to purchase new tools for this.
In this webinar on Advanced Forecasting, we show you concrete examples on how AI can offer you new insights as a financial. We’re not only looking at the technology, but also the direct applicability.
What do you learn during the webinar?
- How Artificial Intelligence can make your forecast better
- How you as a financial person can benefit from using AI in your forecasts
- How to get started with free tooling
To whom is this interesting?
- Managers Reporting en (Group) Controllers
- Business & Financial Controllers
- IT-managers en Finance Managers
Interested?
Unfortunately, this webinar was held in Dutch and there are no English subtitles available. Are you still interested in the contents of this webinar? Fill out this form, and you can rewatch the webinar.

Rewatch the webinar here!

TimeXtender or Microsoft: which fits your organization better?
When it comes to data management, there are tons of solutions in the market. This makes the choice of the right fit in your organization a challenge. In this blog, we compare and contrast the two most used stacks in the Netherlands right now; the Microsoft Stack and Timextender.
Choosing the right solution
The choice between relying solely on the Microsoft stack or integrating TimeXtender is like stepping into a tailor-made suit shop. As a decision maker, you are in the process of selecting the ideal piece that perfectly aligns with your organization’s unique needs. Each option represents a different attire, and, like designing a suit, it’s about crafting a data strategy that seamlessly suits your goals. Here, you can explore the options against the backdrop of a changing data landscape and the quest for future-proof solutions, helping you create a data management strategy that’s tailor-made for your success.
To first understand the options available, you need to be aware of the differences, similarities, and capabilities of each tool.
Microsoft Fabric
What is it?
Considered as a Software as a Service (SaaS), Fabric is designed to remove the complexity of integrating all data activities within an organization. By standardizing the storage of data and combining Data Warehousing, Data Engineering, Data Factory, Data Science, Real Time Analytics and Power BI, collaboration between teams/members is seamless and easier than ever before. This also comes with unified governance principles and computing resource purchases, making them more efficient for your organization. For a deeper dive into its different propositions, you can refer to our other blog on Microsoft Fabric, but for now we will actively look into what Microsoft has to offer when it comes to data management.
Data management in Microsoft Fabric
Microsoft offers a comprehensive set of tools and services for data engineering, which is a crucial part of the data lifecycle that involves collecting, processing, and preparing data for analysis and consumption. Microsoft’s data engineering proposition is centered around its Azure cloud platform and a wide range of products and services designed to help organizations manage their data effectively. Among Microsoft key functionalities for data management, we can find:
- Azure Data Factory to create, schedule, and manage data pipelines.
- Azure Databricks for big data processing, data exploration, and machine learning.
- Azure Synapse Analytics that combines enterprise data warehousing and big data analytics.
- Azure Stream Analytics that allows real-time data ingestion and processing.
- Azure Data Lake Storage, which is a scalable and secure data lake solution for storing large amounts of structured and unstructured data.
- Azure SQL Database offers managed relational database services that can be used for structured data storage and processing.
- Azure Logic Apps and Azure Function; serverless computing services can be used to build data processing workflows and automation.
TimeXtender
What is it?
TimeXtender serves as a low-code software platform with a primary focus on simplifying and automating the intricate steps involved in data integration, modeling, and preparation for analytical purposes. Its core mission revolves around streamlining the often-complex process of extracting, transforming, and loading data from diverse sources into a centralized data warehouse. By doing so, it empowers organizations to effortlessly access and analyze their data, thereby facilitating data-driven decision-making with ease and efficiency.
Where TimeXtender can play a part
TimeXtender is not a direct substitute for all of Microsoft’s offerings. However, it presents several capabilities that can complement Microsoft’s data engineering features and bring value and potentially substitute certain capabilities:
- Integration: Similar to Azure Data Factory. It can extract data from various sources, transform and load it into data warehouses, data marts, or data lakes.
- Metadata Management: Allows you to document, track, and manage data lineage, transformations, and dependencies.
- Data Transformation: TimeXtender can replace some of the functionality provided by services like Azure Data Factory, Azure Databricks, or Azure Data Lake Analytics for ETL (Extract, Transform, Load) tasks.
- Automation: Throughout the data integration process, similar to what Azure Logic Apps and Azure Functions offers for workflow orchestration and event-driven data processing.
- Data Warehousing: Used to create and manage data warehouses, making it a potential alternative to Azure Synapse Analytics for smaller-scale data warehousing needs.
However, there are several areas where TimeXtender may not provide a direct substitute:
- Real-time Data Processing: Azure Stream Analytics is designed for real-time data processing and event-driven architectures, which is not a primary focus of TimeXtender.
- Big Data Processing: TimeXtender is not specifically designed for big data processing at scale, as is the case with Azure HDInsight. It’s better suited for traditional data integration and warehousing scenarios.
- Serverless Computing: Services like Azure Functions are used for serverless computing and custom data processing tasks triggered by events. TimeXtender doesn’t provide serverless computing capabilities.
- Data Lake Storage: Azure Data Lake Storage is optimized for large-scale, unstructured data storage, which is not the primary function of TimeXtender. TimeXtender is more focused on data integration and automation.
What is the right fit for you?
Using only the Microsoft Stack:
If your organization is heavily invested in the Azure ecosystem, including Azure SQL Data Warehouse, Azure Data Lake Storage, Azure Data Factory, and other Azure services, it may make sense to leverage the full suite of Microsoft tools. Also, if your data engineering team is already well-versed in Microsoft technologies and lacks experience with third-party tools like TimeXtender, sticking with the Microsoft stack can be more straightforward and cost-effective in terms of training and skill development.
Moreover, using only Microsoft services can simplify your cost management, as you’ll have a single billing platform (Azure) for all your data-related expenditures. This can make it easier to monitor and optimize your cloud costs.
Integrating TimeXtender:
If your data integration requirements are complex and involve a wide range of data sources, formats, and transformations, TimeXtender’s user-friendly interface and automation capabilities can simplify the process and reduce development time. It also excels in metadata management, making it an excellent choice if you need strong data governance, lineage tracking, and documentation of data transformations.
If your organization operates in a hybrid cloud or multi-cloud environment, where you use a combination of cloud providers or on-premises data sources, its flexibility can help bridge the gap and provide an integration in a low-code solution for a wider set of users without a necessary background in data engineering.
In many cases, organizations opt for a combination of both approaches. They use Microsoft’s native services for certain tasks and integrate TimeXtender where it adds value, such as for data integration, metadata management, and rapid development. Ultimately, the choice should align with your organization’s unique needs, skillsets, and long-term data strategy. Just like with your local tailor, it’s important to evaluate the possibilities with experienced consultants and assess how each option fits into your overall data engineering architecture. This way you can obtain the most optimal result for your business.

Webinar: How to standardise reporting with IBCS?
When your company produces dozens of monthly (management) reports, dashboards and ad hoc analyses, chances are that these reports and dashboards all look slightly different. In other sectors, having standardized communication is commonplace. The International Business Communication Standards (IBCS) standardizes the language in dashboards and reports. But what does it mean to standardize reporting language? In 20 minutes, our expert will tell you everything you need to know.
We have been working with the International Business Communication Standards (IBCS) for years. This standard unifies the language of reports and dashboards so that business communication becomes more effective. A study done by the Technische Universität München (TUM) shows that with correct use of IBCS®, analysis speed increases by 46% and decision accuracy increases by 61%.
But what is IBCS all about? And how can you implement these standards within your organization? In 20 minutes, our expert explains all the details of how IBCS can help your organisation.
You can now watch the webinar!

How do you optimize the Order to Cash process?
Every finance manager knows that the Order to Cash (O2C) process is the lifeblood of any organization. Since it's the journey every customer goes through, from the time an order is placed to the time payment is processed, a smooth, efficient and error-free O2C process is crucial to an organization's financial success and customer satisfaction. But how can we ensure and improve the efficiency of this complex process? The answer lies in Process Mining.
What is Process Mining?
Process Mining is a data analysis technique that aims to discover, monitor and improve real processes by extracting knowledge from event logs, which record the execution of processes in information systems.
What is the impact of Process Mining on the O2C process?
Implementing Process Mining within the O2C process can yield significant benefits. McKinsey research shows that companies that implement Process Mining can achieve up to 20% more efficiency in their O2C process. This means faster order turnaround, fewer errors and delays, and ultimately happier customers. In addition, using Process Mining can lead to a 10-20% improvement in operational efficiency, according to the company.
But Process Mining provides even more optimization. Another study conducted by Gartner showed that using Process Mining can lead to a 20-30% reduction in order-to-cash process lead time.
In addition, companies can significantly reduce their Days Sales Outstanding (DSO). Research by Gartner shows that with Process Mining, companies can reduce their DSO by an average of 15%, which has a direct impact on cash flow.
Process Mining offers opportunities for finance managers
For finance managers, Process Mining offers a gold mine of insights and opportunities. With real-time insight into the O2C process, finance managers can make data-driven decisions, manage risk and deploy their team more efficiently.
This is obviously hugely important at a time when digitization, automation and data analytics are key to competitive advantage. In this regard, Process Mining is an essential tool for any finance manager looking to move their organization forward.
Rockfeather and Process Mining
At Rockfeather, we understand the importance of efficient business processes. With our expertise in Process Mining, we help organizations optimize their O2C process, reduce costs and increase competitiveness. Contact us to find out how we can help you take your O2C process to the next level.
More posts?
Artificial Intelligence is ready!
In this interview, Jonathan Aardema talks with Prof. Eric Postma (professor of Cognitive Science and Artificial Intelligence at the University of Tilburg) about the why, how, and what of artificial intelligence applications. What do we see in practice, and what does science say about it?

Visiting London for the Tableau Partner Executive Kick-Off 2020
Every year Tableau invites its most valuable partners to kick off the new year together. The theme for this year was Accelerate, so let’s get right to the point. This exciting event was focused on three main areas.

Mastering DAX
Keeping your skills up to date is crucial when you work with the newest technology. At Rockfeather, we challenge each other to be the best version of yourself. That’s why I attended the mastering DAX course. DAX (Data Analysis Expressions) is a formula expression language. Next to Power BI, DAX is applied in Excel Power Pivot and tabular models in SQL Server. Learn it once, use it tomorrow.

Microsoft Fabric
Software as a Service (SaaS)
OneLake
Copilot
What is Microsoft Fabric?
Microsoft Fabric is Microsoft’s new solution, integrating multiple services that can be used across your organization’s data pipeline. This enables a more fluent collaboration across your data-oriented activities, from data engineering and data science to data visualization. The foundation of Fabric is OneLake, the single data lake to which all data across your organization is stored. Having only one place where all data is stored in the same format improves computing efficiency and flexibility, removes data duplication and eliminates limitations due to data silos. Each domain/team can work from their own workspace, located within OneLake. They can use any computing engine of their liking, store their data to its necessary format, using a data Warehouse or Lakehouse, and use any application to maximize the insights of their data. 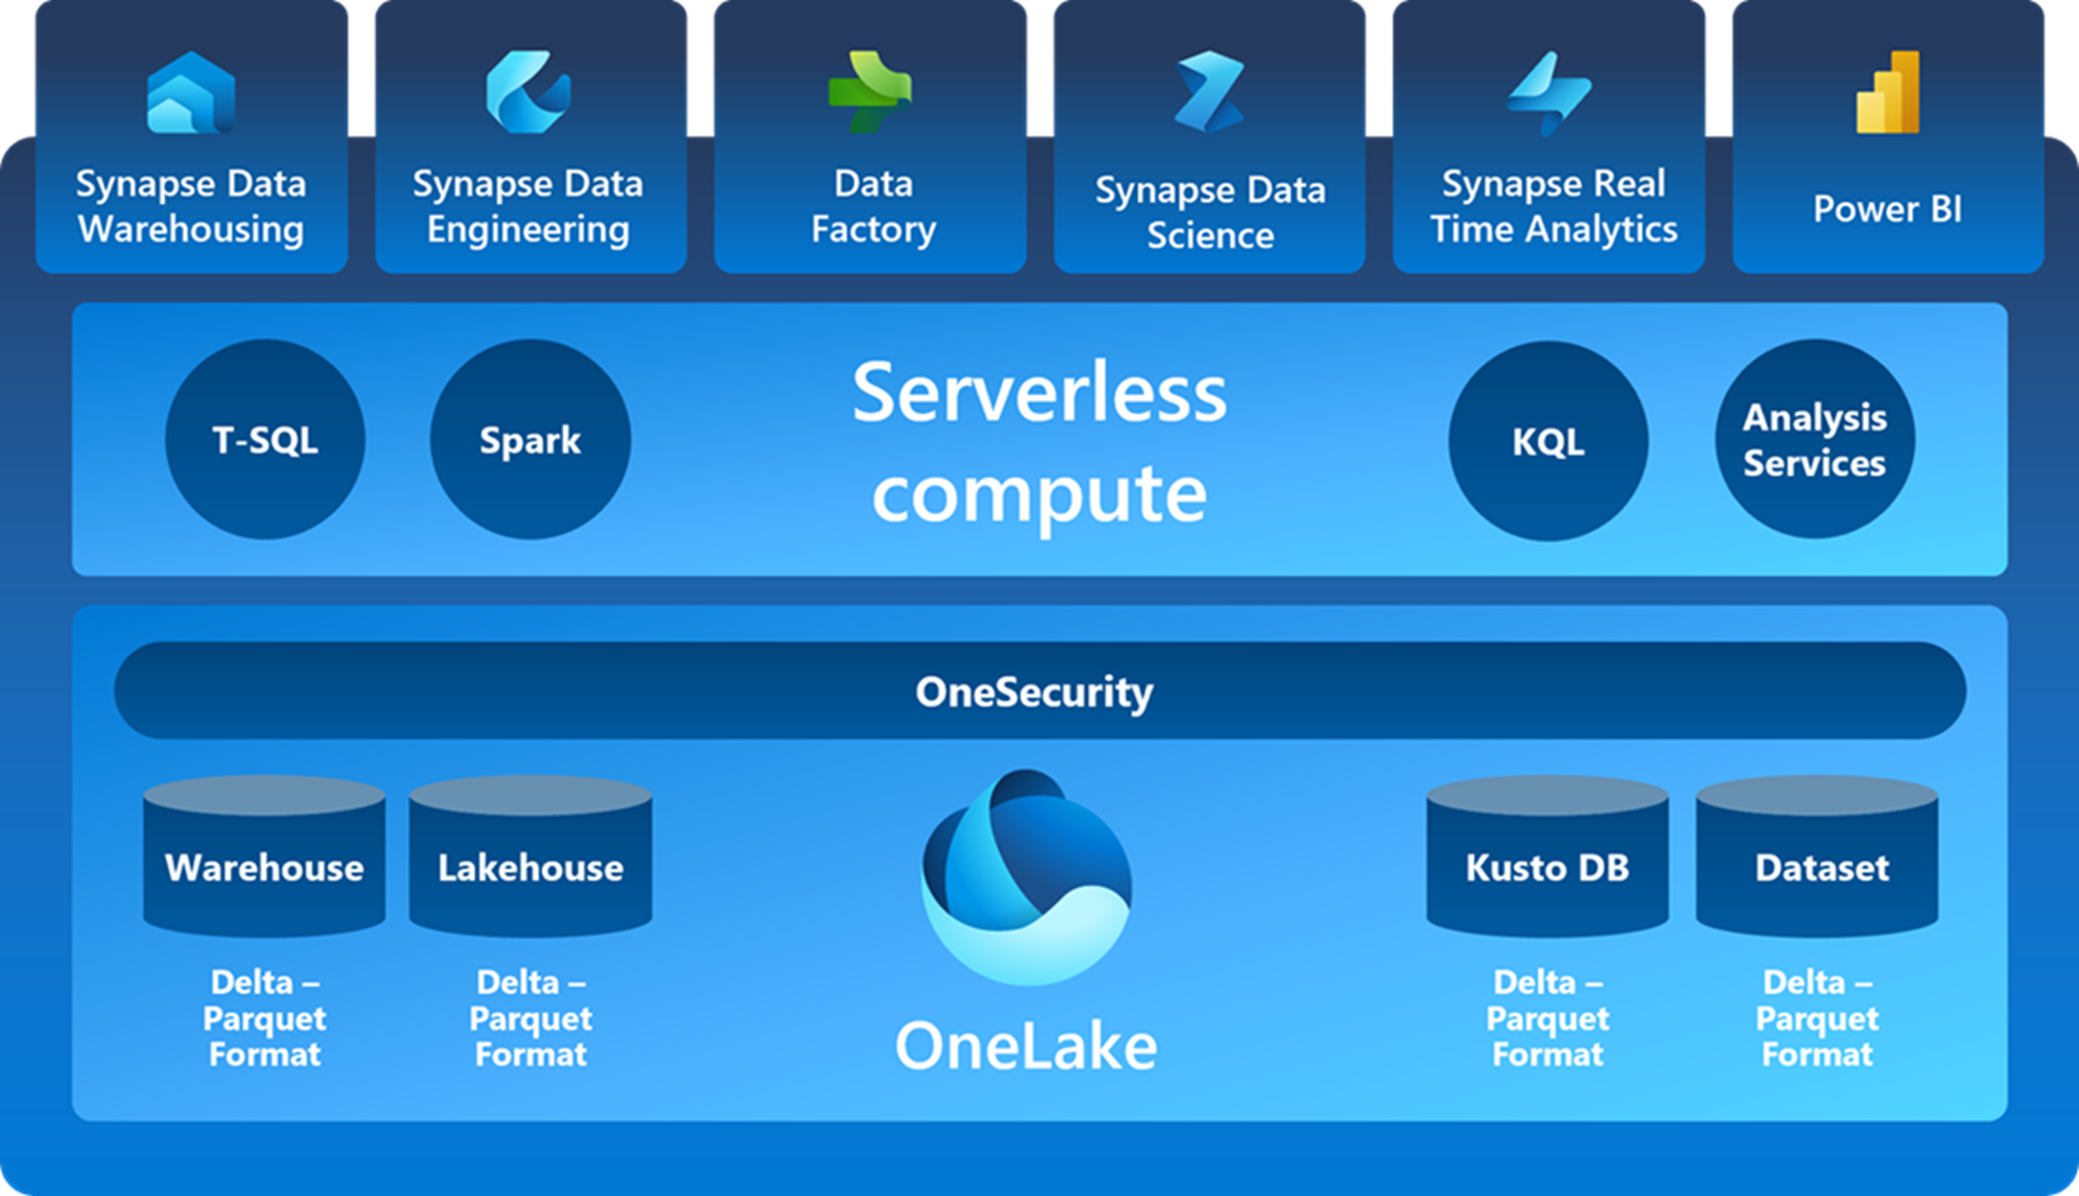
Together with Microsoft Fabric, the AI powered Copilot is introduced. It uses Large Language Models to assist users of any application. By typing any request in natural language, Copilot suggests clear and concise actions in the form of code destined for Notebooks, visuals and reports in Power BI or data integration plug-ins.
What does Fabric offer?
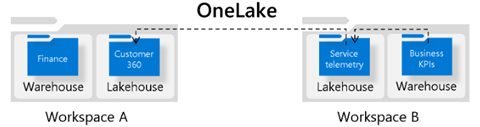
Fabric is a Software as a Service. This means that Fabric is designed to remove the complexity of integrating all data activities within an organization. Simply put, data stored in Workspace B can be accessed in Workspace A via a shortcut between the Lakehouses. This prevents data duplication and improves storage performance. As a result of standardizing the storage of data and combining Data Warehousing, Data Engineering, Data Factory, Data Science, Real Time Analytics and Power BI, collaboration between teams/members is seamless and easier than ever before. This also comes with unified governance principles and computing resource purchases, making them both more efficient for your organization as a whole. Data sensitivity labels will therefore be standardized across domains and data lineage can be tracked across the data pipeline. To empower every business user, it is possible to integrate all insights discovered in Fabric to Office tools. Sharing the results of your Data Science project via mail or sharing your new Power BI report during a Teams meeting is possible with a single click.
Copilot
Copilot offers all Fabric users the possibility to generate deeper insights into their data. Even inexperienced users are able to successfully complete tasks like data transformations or creating summarizing visuals with help from copilot. However, be cautious with using Copilot. Since it’s an AI powered service, its answers depend on your personal input and its answers should always be critically looked at.
Advantages of fabric
- Increase in collaboration with other teams
- Seamless integration of services
- Scalability
- Cost Efficiency
- User-friendly experience
- One Copy Principle
Want to know more about Microsoft Fabric?
Want to know more about Microsoft Fabric as a service? Take a look at the Fabric Masterclass that dives deep into different Fabric use cases for Data Science, Data Engineering, and Data Visualization.
Want to know more about Microsoft Fabric?
Data Engineering in Microsoft Fabric
In Microsoft Fabric, data engineering plays a pivotal role to empower users to architect, construct, and upkeep infrastructures that facilitate seamless data collection, storage, processing, and analysis for their organizations.
Data Science in Microsoft Fabric
Microsoft Fabric is a platform that offers Data Science solutions to empower users to complete end-to-end data science workflows for data enrichment and business insights. The platform supports a wide range of activities across the entire data science process, from data exploration, preparation, and cleansing to experimentation, modeling, model scoring, and serving predictive insights.
Data Visualization in Microsoft Fabric
By seamlessly integrating with Power BI, Microsoft Fabric revolutionizes how you work with analytics.
Data Engineering in Microsoft Fabric
In Microsoft Fabric, data engineering plays a pivotal role to empower users to architect, construct, and upkeep infrastructures that facilitate seamless data collection, storage, processing, and analysis for their organizations.
Data Engineering in Microsoft Fabric encompasses three main components:
- Data Engineering: This aspect involves collecting data from various sources, processing it in real-time or batch mode, and transforming it into actionable insights. Microsoft Fabric’s Data Engineering ensures scalability and flexibility, making it suitable for handling diverse data challenges.
- Data Factory: As a fully managed data integration service, Data Factory enables the creation and orchestration of complex data workflows. It allows seamless data movement and transformation across different sources and destinations, simplifying data processing and ensuring efficiency.
- Data Warehousing: Provides a centralized repository for structured and unstructured data. It offers scalable and secure storage, ensuring efficient query performance and easy access to critical data.
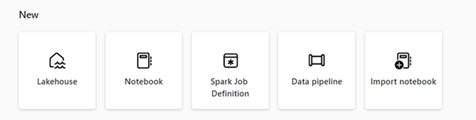
These three main components are in turn made accessible through key features available from the data engineering homepage that include:
- Lakehouse creation and management where users can oversee their data, providing a unified repository storage and processing.
- Pipeline design, enabling efficient data copying into their Lakehouse.
- Spark job definitions to easily submit batch and streaming jobs to the Spark cluster for processing and analysis.
- Notebooks to craft code for data ingestion, preparation, transformation, and streamlining data engineering workflows.
Business case:
In the dynamic world of retail, a savvy company harnesses Microsoft Fabric’s array of tools to revolutionize their data landscape. OneLake, their all-encompassing data repository, harmonizes sales, inventory, and customer data streams. By orchestrating seamless data pipelines, they channel diverse information into OneLake with precision. Spark job definitions section empowers you to do real-time analysis, unraveling intricate sales trends and highlighting inventory fluctuations. The utilization of interactive notebooks within this ecosystem streamlines data engineering, refining information for impactful Power BI reports. This seamless integration fuels agile decision-making, propelling the retail venture toward strategic brilliance amidst a competitive market.
Want to know more about Microsoft Fabric?
Want to know more about Microsoft Fabric as a service? On October 26 we’re organizing a Fabric Masterclass that dives deep into different Fabric use cases for Data Science, Data Engineering, and Data Visualization.
Want to know more about Microsoft Fabric?
Data Visualization in Microsoft Fabric
By seamlessly integrating with Power BI, Microsoft Fabric revolutionizes how you work with analytics.
Data Science in Microsoft Fabric
Microsoft Fabric is a platform that offers Data Science solutions to empower users to complete end-to-end data science workflows for data enrichment and business insights. The platform supports a wide range of activities across the entire data science process, from data exploration, preparation, and cleansing to experimentation, modeling, model scoring, and serving predictive insights.