Data Science Survey Results
In collaboration with Finext and The Hague University of Applied Sciences, Rockfeather conducted a survey among our customers and other data enthusiast. The survey consists of twenty questions that investigate the data maturity, the presence of a data-mindset, and how they reach and plan to reach their data ambitions and goals.
Curious how data science can help your organization? Press the button below:
Key take-aways Data Science Survey
- Most companies currently are in the analytical aspiration stage but have the aspiration to improve their data maturity;
- Python is the most popular data science programming language;
- Microsoft Power BI and SQL are the most common data visualization and- integration tools;
- Improving data quality is seen as the biggest challenge for implementing a data-driven way of working.
Data maturity and ambitions
Data maturity
The framework as described in: “Competing on Analytics” by Thomas H. Davenport and Jeanne G Harris is used to determine the data maturity of the different companies. This framework distinguishes 5 stages of data maturity:
Stage 1: Analytical Impaired
“Organization has some data and management interest in analytics. “Stage 2: Localized analytics
“Functional management builds analytics momentum and executives’ interest through application of basic analytics”Stage 3: Analytical aspiration
“Executive commit to analytics by aligning resources and setting a timetable to build a broad analytical capability”Stage 4: Analytical companies
“Enterprise-wide analytics capability under development; top executives view analytic capability as a corporate priority”Stage 5: Analytical competitors
“Organization routinely reaping benefits of its enterprise-wide analytics capability and focusing on continuous analytics renewal”Our survey investigates in which stage companies are, based on seven different aspects that are shown in the image below. Click here or on the image to view the full image.
The results show that most companies are in stage 3, but 95% have the ambition to move to the next level or stay at the current stage.

One of the survey’s goals is to investigate how companies in different stages perform in the seven different aspects that determine the data maturity stage. Companies in stages 1-3 are compared with companies in stages 4 & 5. The results showed that companies who want to move past the third stage should improve in all aspects. This is in line with the general idea that if a company wants data science to be a competitive advantage source, they should embrace it in the whole company. Although it is important to improve all aspects, a few need some extra attention: Data, Analytical techniques, and the Enterprise.
Data investments
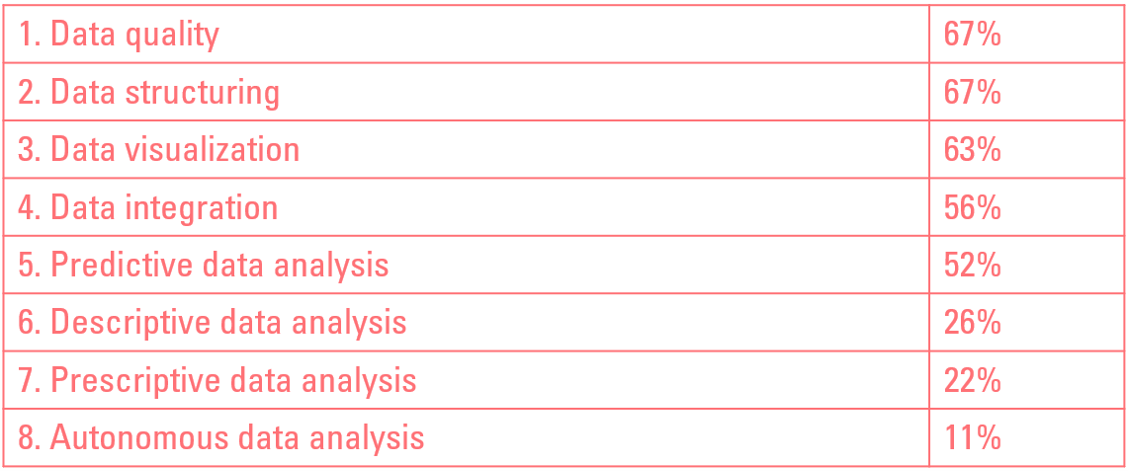
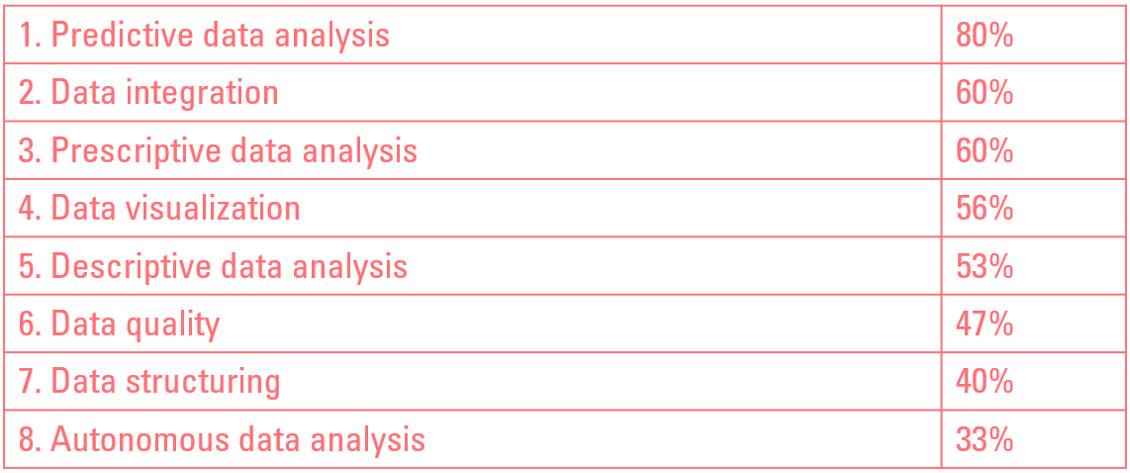
To better understand how companies plan to reach the next stage, the survey questioned them about their planned investments in the upcoming year and in three years. The outcome shows that in the upcoming year, companies heavenly invest in data structure and data structuring. This is a logical first step since this is the foundation for further data analysis.

When analyzing the investment in the three-year horizon, it is clear that the investments shift from data quality and -structure to predictive data analysis, data integration, and prescriptive data analysis.

Data Tools
Data science programming languages
When it comes to data science programming languages, Python is on top; it is used by 42% of the companies. This is definitely in line with the industry and Rockfeather’s customers. Want to know more about data science in general and how it can help your company, visit our data science web page. The top 5 most popular data science programming languages are:

Data visualization tools
There is a clear winner concerning data visualization tools, and it is Microsoft Power BI, with Tableau and Oracle on appropriate distance. This is in line with the trends we see in this field and the yearly research conducted by Gartner. This research shows that Power BI has strengthened its leading position in completeness vision and ability to execute. Want to know more about the magic quadrant for Business intelligence tools? Read Rockfeather’s blog and watch the webinar on the Gartner Magic Quadrant for Analytics and Business Intelligence Platforms 2020! The top 5 most popular data visualization tools are:

Data integration
In terms of data integration, SQL and Excel are still miles ahead of data warehouse-, data virtualization, and data lake tools. Data integration combines data from different sources and includes data cleaning, and ETL (Extract, Transform, Load) involves the ETL process. It is crucial for further data visualization and data science processes. The top 5 most popular ways to perform data integration are:

Challenges
Data science is more likely to reach its full potential if it is adopted in the whole company. This requires a data-driven way of working, which of course, comes with challenges. The biggest challenge is to improve the data quality; this is crucial for the success of any data-related project. The top 5 biggest challenges in implementing a data-driven way of working are:

Last but not least
Rockfeather donates 5 euro for every unique respondent towards the United Nations World Food Program so that they can help the people who need it the most.
Data Science Discovery Session
Curious how data science could help your organization? Fill in the contact form below for a free data science discovery session. Click here for more info.
FREE: Data Science Discovery Session
Are you curious about how data science can help your organization? During this free discovery session, we will take a look at your business' most potential use cases.

Artificial Intelligence is ready!
In this interview, Jonathan Aardema talks with Prof. Eric Postma (professor of Cognitive Science and Artificial Intelligence at the University of Tilburg) about the why, how, and what of artificial intelligence applications. What do we see in practice, and what does science say about it?

Visiting London for the Tableau Partner Executive Kick-Off 2020
Every year Tableau invites its most valuable partners to kick off the new year together. The theme for this year was Accelerate, so let’s get right to the point. This exciting event was focused on three main areas.

Mastering DAX
Keeping your skills up to date is crucial when you work with the newest technology. At Rockfeather, we challenge each other to be the best version of yourself. That’s why I attended the mastering DAX course. DAX (Data Analysis Expressions) is a formula expression language. Next to Power BI, DAX is applied in Excel Power Pivot and tabular models in SQL Server. Learn it once, use it tomorrow.
