
Why data science isn't magic: an introduction to data science
Data science, artificial intelligence and machine learning are terms that you might have seen before. Companies big and small are jumping on the data science bandwagon. Although the incentive is there, the fundamental understanding often lacks. In this introduction to data science you will learn all about the basics and fundamentals. Get started!
The fundamentals: data
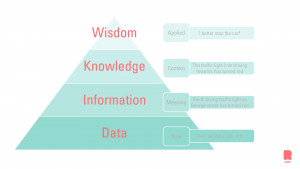
Data without context is gibberish, just as the word ‘red’ has no inherent meaning except for being a color. But in context, e.g. “the traffic light’s color is red”, you can use that information to anticipate your next actions. You can use the DIKW (Data Information Knowledge and Wisdom) pyramid to put data in context.
What is data science?
Since this blog is an introduction to data science, let’s start with the basics. With data science you use data and give meaning to the data. In other words, transform data to information. This transformation can be done by visualizing data, learning the processes in which the data is used, and/or understanding the metadata. The information will be transformed into knowledge when you provide the context. Once all the cards are on the table, we can plan for action: wisdom!
Wisdom is where we apply our knowledge to the best of our abilities. Data scientist usually report their findings with a recommendation to the management. The DIKW pyramid is the foundation of data transformation. Every data scientist or machine learning engineer goes through this process explicitly or implicitly.
Data science & data mining
Now that we know what cycle the data goes through, we can start looking at the good stuff: data mining. Data mining is a field in data science that is concerned with retrieving data and creating predictions. This definition is a nuance since it covers a wide area of things, but since this is an introduction to data science, we want to keep it simple in this blog. Also, these definitions are not set in stone and vary from time to time and from person to person. We use data mining techniques to predict what new data will do, based on old data. In other words, we train models with old data to predict what new data will do. We will be covering two techniques of data mining: supervised and unsupervised.
Supervised Learning
What is Supervised learning?
Supervised learning means we have both the characteristics and the answer to the question. Much like teaching a kid the difference between a dog and a cat, we teach the model in a similar fashion. The next figure shows the characteristics of a dog and a cat. The characteristics describing the animal are called ‘features’. These features describe an animal, namely a dog or a cat. The element that is described by the features, is called the ‘class’ or ‘target’ (variable). In almost any case, you structure the layout of the features with its class in a table. We refer to the total number of features as the dimensionality of the dataset. The more features you have, the more information you have for predicting the class. However, too many features can cloud the model, damning your dataset with the curse of dimensionality.
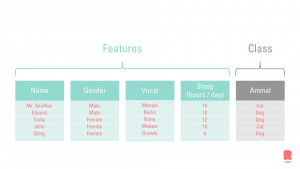
The model tells us its prediction based on the characteristics, and we can assess (supervise) whether the model has predicted the class correctly. If not, we will adjust the model and tell him which characteristics are important, and which are not. This way of working is the premise of supervised learning in a nutshell. If you are looking for a Data Science and Machine Learning solution, then Gartner’s Magic Quadrant is a valuable resource.
Unsupervised learning
What is Unsupervised learning?
Unsupervised learning means we do not have the answer to the question (i.e. we do not have a class variable), but we deduce the answer by comparing the characteristics. When we are at a social event, small groups will form. We can use the proximity (characteristic) of the people to see which group they belong to. We can then label the people with, say, colored t-shirts. The t-shirts represent the class variable. Once they all wear the t-shirts, and new characteristics arise, we are still able to tell who belongs to which group. That is the gist of unsupervised learning. There are more methods such as semi-supervised learning or reinforcement learning. Now that you’ve learned all about the basics and fundamentals in this introduction to data science, we want you to go down that rabbit hole on your own.

Related posts
Artificial Intelligence is ready!
In this interview, Jonathan Aardema talks with Prof. Eric Postma (professor of Cognitive Science and Artificial Intelligence at the University of Tilburg) about the why, how, and what of artificial intelligence applications. What do we see in practice, and what does science say about it?

Visiting London for the Tableau Partner Executive Kick-Off 2020
Every year Tableau invites its most valuable partners to kick off the new year together. The theme for this year was Accelerate, so let’s get right to the point. This exciting event was focused on three main areas.

Mastering DAX
Keeping your skills up to date is crucial when you work with the newest technology. At Rockfeather, we challenge each other to be the best version of yourself. That’s why I attended the mastering DAX course. DAX (Data Analysis Expressions) is a formula expression language. Next to Power BI, DAX is applied in Excel Power Pivot and tabular models in SQL Server. Learn it once, use it tomorrow.