Our Content
Welcome to our content section. We have content about everything on Data Visualization, Data Engineering, Data Science, Low Code, Technologies. You can find the subjects you are looking for by using the filter option below. Please contact us if you want to share your thoughts about our content.

What if your dashboards turn out to be misleading?
An effective dashboard is a tool for getting clear insights into your data. But what if a dashboard is less effective than imagined? Or even worse; what if your dashboards mislead users? In this blog, we discuss two new features of Power BI. One can mislead your users, while the other makes your dashboards more effective.

Looking back: Data & Analytics Line Up 2022
Want to know what’s on sale for dashboarding or data integration solutions? Want to compare data science solutions? Or would you like to see Low Coding platforms in action? This and more was discussed at the Data & Analytics Line Up 2022!
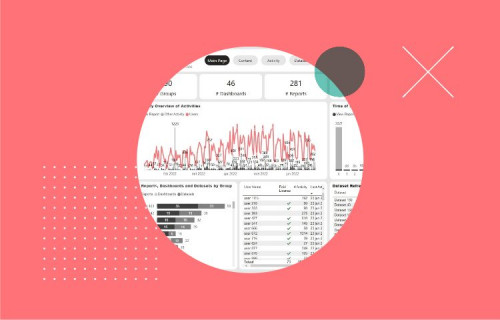
Become a better admin with the Power BI Admin Dashboard
The Power BI Admin Dashboard is a feature in Microsoft Power BI that gives the people overseeing Power BI users more information in an easy-to-read dashboard. Through the power of the Azure portal or Office 365 platform, the Power BI Admin dashboard has more features to take monitoring to the next level.

The Future of Data & Analytics 2022
The Future of Data & Analytics 2022 took place on June 14. During this yearly event, we were inspired by speakers that shed a light on how they implemented a successful data & analytics strategy.

Online Workshop Tableau (Dutch spoken)
In this free (dutch) workshop we will teach you how to load, visualize and analyze your data in Tableau.

Online Workshop Power BI (dutch spoken)
In this online workshop, you will learn about several key features of the Power BI service. This introductory course is designed to teach you step-by-step how to create Power BI Desktop reports. Fill in your details to view this session!
Language workshop: Dutch.

Data Science meets Data Viz - Spotify Dashboard
Visualising your data is a great way to bring the right message across to your audience. Until now, data processing scripts or low-code functionality enabled BI analysts to transform the data and filter out only the most important data. At the same time, many BI analysts are pumping up their python (or R) knowledge to apply more advanced analytics to their data and visualise that in a dashboard or low-code app.
Automated reports with Power BI Report Builder
The fact that Power BI can be used to create dashboards is by now known to many organisations. However, many people do not know that there is a tool within Power BI that can help when there is a specific demand for (automated) PDF or Excel reports. This tool is called Power BI Report Builder. In this article, we will take a closer look at Power BI Report Builder to give you a better understanding of this tool.

Gartner Magic Quadrant for Analytics and Business Intelligence Platforms 2021
For years, Gartner’s Magic Quadrant for Analytics and Business Intelligence has been the leading report in the world of data visualization. However, many people only look at the 2×2 matrix without going into the details of the report.