
Mastering Dashboard Success: Requirements & Storytelling
Although it is essential, the value your dashboard can achieve is not entirely dependent on the data you have available. It can become equally important to show the story behind your data in the most efficient way possible while critically assessing the audience for and purpose of your dashboard. A lack of focus on those fundamentals can result in an abundance of reports created without properly considering business needs.
Target audiences will be overrun with purposeless dashboards that do not show the required insights. Ultimately, dashboards have a low adoption rate, the traditional way of working in siloed environments continues, and potential growth through data-driven insights slumbers down. Sounds familiar? But how to get the right dashboard success requirements?
Common Mistakes in Dashboard Success
Suboptimal internal support:
- Setting goals: An unclear, unstructured, or incomplete start to a dashboarding project results in improper dashboard requirements. Asking the right questions and gathering the necessary people is decisive in setting proper goals. Failing to do so creates ambiguity and does not deliver the intended insights.
- Setting rules: Not setting clear rules regarding roles, responsibilities, and the way of work can also result in ambiguity and an inefficient use of resources. One of the most underestimated responsibilities is validating results.
Dashboard inefficiencies:
- Data Interpretability: When developing a dashboard, the focus should not be on fancy or complex ways to visualize your data but on using the best visualizations to tell the story within your data. Insights should be shown quickly and chronologically in the clearest way possible.
- Design: Although it can be tempting to use bright colors, multiple fonts, or flashy visuals, this all comes at the expense of a dashboard’s purpose: to show the unbiased message that data can reveal. Inefficient and inconsistent use of layout or positioning within or between dashboards can harm your data story.
- Dashboard requirements: A common pitfall is to lose track of requirements when building a dashboard. It is important always to consider the target audience and goal during dashboard development.
Lack of user engagement:
- User involvement: Users are often involved early in the process but left out until the final product is delivered. This long gap without feedback can lead to reports that do not meet user needs, decreasing the willingness to adopt a new dashboard.
- Technical development: Users may find new tools like Power BI daunting and prefer sticking to familiar tools like Excel, fearing job automation.
Dashboard Success Requirements
From these common pitfalls, suboptimal internal support and dashboard inefficiencies can be structurally addressed. They require a focus on the true purpose of your dashboard, which makes the dashboard both optimally functional and aligned with your organization’s needs.
Support & Stakeholder Management
Sufficient internal support throughout both the development and ongoing use of the dashboards is crucial. This begins with a deep understanding of the dashboard’s purpose and end users. What do they want to see, and more importantly, how do they want to see it? This understanding forms the foundation of your dashboard’s design and directly impacts how easily the data can be interpreted. Regular engagement with users ensures that the dashboard continues to meet their needs and tells a logical and coherent story. Remember, what seems obvious to a developer may not be clear to end users.
Let’s get practical – what can be done to get to the dashboard’s essentials? Enter our BI Canvas. This tool covers all the essential components that determine the effectiveness and adoption of your dashboard. Think of it as the blueprint for your dashboard. By carefully filling in each component, you ensure that you’re telling the right story, to the right audience, in the right way. By using this method, you can systematically address the key areas of dashboard development, ensuring that your dashboards are not only functional but also insightful and widely adopted.
Data storytelling
The design of your dashboard is pivotal in making data look straightforward. Moreover, the importance of making your data as simple and quickly ingestible as possible can’t be stressed enough. The essence is to show the message that is hidden in your data that contains the answer to your organization’s needs and thus, the focus should be on those two things; your data story & your business requirements. A dashboard must communicate that message as clearly and quickly as possible.
There are many ways in which the story in your data can be conveyed by a dashboard. It can be done by disrupting changes in the current structure of your dashboard and the way-of-work of dashboard development, or by many small adjustments that altogether improve your storyline. By focusing on visual design, filtering, context, clear requirements and framing, the data in your dashboard can be converted into insights!
Curious about what the BI Canvas entails or how to improve data storytelling? Stay tuned for an update in the near future!

Artificial Intelligence is ready!
In this interview, Jonathan Aardema talks with Prof. Eric Postma (professor of Cognitive Science and Artificial Intelligence at the University of Tilburg) about the why, how, and what of artificial intelligence applications. What do we see in practice, and what does science say about it?

Visiting London for the Tableau Partner Executive Kick-Off 2020
Every year Tableau invites its most valuable partners to kick off the new year together. The theme for this year was Accelerate, so let’s get right to the point. This exciting event was focused on three main areas.

Mastering DAX
Keeping your skills up to date is crucial when you work with the newest technology. At Rockfeather, we challenge each other to be the best version of yourself. That’s why I attended the mastering DAX course. DAX (Data Analysis Expressions) is a formula expression language. Next to Power BI, DAX is applied in Excel Power Pivot and tabular models in SQL Server. Learn it once, use it tomorrow.

Harnessing Data Power with DBT
In today's data-centric business environment, mastering the art of transforming data into actionable insights can dramatically differentiate leaders from followers. Have you ever been in a situation where you doubted the reliability of your data, leading to decision paralysis? Then continue reading this blog!
DBT (data build tool) steps in as a transformative ally, granting businesses not just access to but also confidence in their data for strategic decision-making. Let’s explore the essence of dbt and how it serves as a catalyst for data-driven decision-making, enhancing data integrity, and optimizing operations.
Introducing dbt
Imagine dbt as the bridge that safely carries raw data across uncertainty to analysis-ready information. It’s designed to refine data stored in warehouses into a clean, dependable format, allowing businesses to unlock strategic insights with assurance and precision. Want to know more about the dbt technology? Have a look at our technology page!
Empowering strategic decisions
DBT is the foundation for transforming unprocessed data into a reliable asset for decision-makers. This enables businesses to approach strategic planning with a high level of confidence. Knowing their actions is informed by robust, trustworthy data insights.
Elevating Data Quality & Trust
In the fast-moving stream of today’s business landscape, the value of data quality and reliability cannot be overstated. DBT tackles this challenge head-on, implementing meticulous testing and validation protocols to ensure data accuracy. This critical step cultivates a deep trust in data-driven insights that are essential for informed decision-making.
Streamlining operations
A standout feature of DBT is its ability to automate the data transformation process. This automation not only minimizes manual labor and the potential for human error but also enhances operational efficiency. Simplifying complex data workflows allows businesses to devote more energy to their core objectives, leveraging insightful data for growth and efficiency.
A Financial Services Firm Case Study
Consider a hypothetical financial services firm that utilizes dbt to unify transaction data from diverse systems. Through the robust testing capabilities of dbt, the firm can guarantee the precision and reliability of their data, enabling accurate fraud detection and informed credit risk assessments. This case underscores how dbt can refine operations and reinforce client trust.
The Benefits of dbt
-
- Data Confidence: Rigorous validation ensures a trusted base for critical business strategies.
- Operational Streamlining: Automation reduces manual tasks and errors, elevating process efficiency.
- Accelerated Insights: DBT’s streamlined process fosters quicker transitions from data to decisions, enabling agile responses to market dynamics.
- Enhanced Data Governance: Automated documentation and clear lineage enhance governance, ensuring compliance and transparency.
- Scalable Flexibility: With support for various data warehouses and a code-centric approach, dbt is built to grow with your business, adapting to changing needs.
In summary, dbt stands out as a key tool in the modern data stack, equipping businesses with the means to turn raw data into actionable insights efficiently. By emphasizing data integrity, reliability, and operational efficiency, dbt is indispensable for any data-driven strategy, empowering companies to navigate the complexities of the business ecosystem with confidence and strategic insights.
This might also be interesting for you!

Data-driven insights with dashboards at ADO Den Haag
As a football club, ADO Den Haag is known for its green and yellow colours and the characteristic stork. However, what many people do not know is that behind the scenes ADO Den Haag is undergoing a true data transformation. The club wants to gain more insight into its performance through data, so that it can better anticipate and steer. The first step is the automation of manual overviews and the creation of dashboards in Power BI.

Data-driven planning at ProRail
By 2030, ProRail aims to have 30% more capacity for running trains. That demands a lot from the organization and the management. Data-driven insights are therefore indispensable. Dashboards in Microsoft Power BI provide real-time information about the performance, trends and consequences for the planning of track works. This improves process-oriented and data-driven decision-making so that ProRail can fulfil its strong growth ambition.

Connecting API’s how hard can it be
Spoiler alert: it can be hard...
Building a data-driven solution starts with extracting data from your systems. For many cloud applications, this requires leveraging APIs. In this blog, we will explain the fundamentals of APIs and their challenges and share easy-to-use tools to help you get started and kickstart your data-driven journey.
Fundamentals of APIs
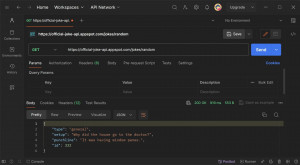
At its core, an API (Application Programming Interface) is a set of rules that allows communication between different software applications. It serves as a bridge, enabling applications to exchange data. An API operates like a messenger; it takes requests, tells a system what you want to do, and then returns the system’s response. To see it in action, try copying and pasting the following link into your browser:
https://official-joke-api.appspot.com/jokes/programming/random
When you hit ‘Enter,’ a request is sent, and based on the API rules, you receive a random programming joke as a response, like this one: [{“type”:”programming”,”setup”:”How much does a hipster weigh?”,”punchline”:”An Instagram.”,”id”:146}] The response is in a JSON (JavaScript Object Notation) format, commonly used by most APIs. This JSON can be formatted to make it more human-readable (There are also comments included to explain the JSON syntax)
[ <-- start table
  { <-- start row
    "type": "programming", <-- kolom: value
    "setup": "How much does a hipster weigh?",
    "punchline": "An Instagram.",
    "id": 146
  } <-- end row
] <-- end table
The same data In table format:
| type | setup | punchline | id |
|---|---|---|---|
| general | How much does a hipster weigh? | An Instagram. | 146 |
Congratulations! You’ve taken your first steps into the world of APIs. While this example was straightforward, it’s worth noting that not all APIs are as simple.
Challenges working with APIs
Connecting to an API can be a powerful way to access data, yet it introduces a unique set of challenges. Here are some common challenges:
1. Authentication:
Establishing secure access to APIs can be tricky. Many APIs require authentication to ensure only authorized users or applications can access their data. Authentication methods, including API keys, OAuth tokens, or other custom authentication mechanisms, can vary. It can be challenging to understand the specific authentication method and implement it correctly. Incorrect implementation leads to the notorious “401 Unauthorized” error.
2. Pagination:
For performance reasons, APIs often limit the data returned in each response. Therefore, a significant response is split into smaller pages. Building logic to iterate through the pages until all data is retrieved can be tricky. A frequent error, “404 Not Found,” may occur when accessing a nonexistent page.
3. Rate Limiting:
APIs often enforce usage limits within specific timeframes to protect themselves and underlying systems. Surpassing these limits triggers the “429 Too Many Requests” error code as a protective measurement.
4. Documentation:
API documentation serves as your ally during the API integration journey. Within the documentation, you can discover the requests, authentication methods, pagination guidelines, and any limitations the API may have.
While these challenges might seem overwhelming, tools are available to simplify the connection setup and overcome most hurdles.
Tools for extracting data from APIs
Numerous tools can perform the same trick: connecting and extracting data from an API and storing it somewhere safe, often a database. We’ll spotlight the tools commonly utilized at Rockfeather, each with its own unique strengths and possibilities; it’s worth noting that many alternatives exist.
1. Postman
Postman is a versatile API testing tool primarily focused on debugging and creating APIs. It’s user-friendly and has many features to help you get started with a connection to an API. While its strengths lie in exploration and understanding, it’s noteworthy that Postman cannot automatically store data into a database
2. Airbyte
Airbyte is an open-source platform for data integration. It offers a no-code interface. With over 350 pre-built data connectors, it provides a simple yet robust starting point that seamlessly scales alongside your growing data demands.
One notable feature of Airbyte is its support for custom connectors. Airbyte has you covered with a unique low-code interface if you need to build a custom connector. This interface comes with built-in features for authentication and pagination—features that set Airbyte apart, considering many other tools lack such functionalities.


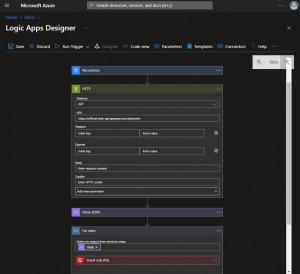
3. Azure Logic Apps
Azure Logic Apps is a cloud-based service for building automated workflows through a user-friendly visual design interface, making it accessible even for those without extensive coding expertise. With 450 pre-built data connectors and an extensive toolkit for custom connectors, Azure Logic Apps stands out as a flexible and universal tool. Its sweet spot is observed when handling more complex APIs with lower data volumes.
Beyond data integration, Azure Logic Apps excels in task automation for sending emails, alerts, surveys, approvals, and system integrations to move data between systems. For example, to synchronize customer information between an ERP and CRM system.
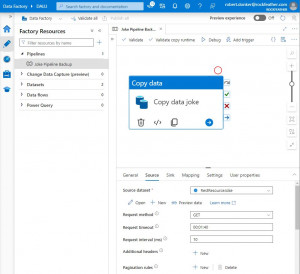
4. Azure Data Factory
Azure Data Factory is a cloud-based service for constructing pipelines. It has a Low code interface with predefined building blocks. Performs best in moving data of high volume from a database or one of its other 80+ connectors. However, it’s less ideal for custom connections.
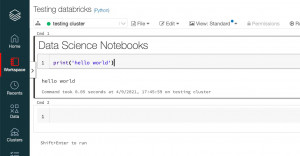
5. Databricks
Databricks is a cloud-based platform for processing big data and machine learning workloads. The platform offers the flexibility of creating and executing notebooks. By writing Python code, you can connect to any data source there is and leverage existing Python packages. However, it’s important to note that Databricks, while powerful, demands a deeper coding knowledge to unlock its expansive platform capabilities fully.
Conclusion
In conclusion, these tools offer diverse approaches to extracting data from APIs, accommodating various preferences, skill levels, business requirements, and data sources. It’s worth noting that a combination of tools may prove more effective for your specific needs. Azure Logic Apps and Azure Data Factory are a common and powerful combination often utilized.
Starting your data journey and connecting to APIs is challenging, especially for beginners. Despite the hurdles, there are tools to assist you. The key is to take that first step.
Want to learn more about the tools we use at Rockfeather? Join us for the Data & Automation Line Up on May 16th. Let’s simplify the process and explore the world of data together.
This might also be interesting for you!
Data-driven insights with dashboards at ADO Den Haag
As a football club, ADO Den Haag is known for its green and yellow colours and the characteristic stork. However, what many people do not know is that behind the scenes ADO Den Haag is undergoing a true data transformation. The club wants to gain more insight into its performance through data, so that it can better anticipate and steer. The first step is the automation of manual overviews and the creation of dashboards in Power BI.
Data-driven planning at ProRail
By 2030, ProRail aims to have 30% more capacity for running trains. That demands a lot from the organization and the management. Data-driven insights are therefore indispensable. Dashboards in Microsoft Power BI provide real-time information about the performance, trends and consequences for the planning of track works. This improves process-oriented and data-driven decision-making so that ProRail can fulfil its strong growth ambition.

How to Kick start your Data Science Project
Terms like data science, machine learning, and AI are being seen and heard more and more. When the AI text generation tool ChatGPT was released, it quickly became the fastest-growing application ever. It took the tool from OpenAI only 5 days to hit 1 million users. To put that into perspective, it took Facebook 10 months and Twitter 2 years!
Where data science has been an exciting topic for the more tech-savvy people for years, it has reached the general public significantly. This new wave of AI popularity has sparked business interest in learning more about data science, AI, and its capabilities. With this blog, we hope to give you some info that can help you kickstart your first data science project, making buzzwords a reality for your organization.
What is data science?
Before we dive into what you can do with data science and how you should approach a project, let’s first quickly discuss what data science is.
Data science is the process of extracting knowledge and insights from raw data. The business can then use this information to empower decision-making and take well-informed action. Data science is essentially the process of extracting value from your data.
Data science combines mathematics and statistics, computer science, and domain expertise. Data science has a lot of different ways to process data and make it valuable. These include data visualization, statistical analyses, text mining, outlier detection, machine learning, computer vision, and many more.
Why should you start with data science?
The International Data Corporation (IDC) predicted in 2017 that the amount of data subject to data analysis would grow exponentially and increase by a factor of 50 within 8 years. We now have some measurements up until about 2022, and the growth predicted by IDC back in 2017 was correct. More and more data are generated. And this is interesting for the data scientist. As discussed above, data can be valuable if we utilize it smartly and effectively.
Data science is at the heart of making sense of the massive amounts of data we generate daily, turning it into actionable insights that can improve decision-making, enhance customer experiences, and even solve critical issues. It’s a superpower in today’s data-driven world, and understanding it means you’re equipping yourself with the knowledge to make a real difference.
Data science is starting to revolutionize multiple scientific fields. To name a few examples: in the medical field, AI has helped with protein folding and quicker and more accurate cancer detection. Massive weather events, like tornado’s, can be predicted by AI systems earlier than was possible before. In the future, self-driving cars will make the roads safer for everyone.
However, for businesses, data science can also make an impact. Research from Forrester (2020), a global market research company, showed that data-driven companies were 58% more likely to beat their revenue goals than their non-data-driven peers.
The adoption of data science into your business can make a real impact.
What can you do with data science?
The possibilities of data science are nearly limitless, touching on virtually every sector imaginable. Depending on the (type of) available data and the goal set for the project, a specific data science approach is chosen. Some examples of what is possible with data science:
Enhancing Customer Experience
Data science can significantly improve customer experience by personalizing interactions based on customer data. For example, retailers can use data science to recommend products to customers based on their browsing and purchase history. This not only increases customer satisfaction but also boosts sales.
Optimizing Operations
Through predictive analytics and machine learning models, businesses can forecast demand, manage inventory more efficiently, and streamline operations. This optimization can lead to cost savings and improved customer service by ensuring products and services are delivered more reliably and efficiently.
Fraud Detection and Risk Management
Financial institutions leverage data science to detect fraudulent transactions in real time, significantly reducing losses. Similarly, insurance companies can use it to assess risk more accurately, setting premiums that more closely reflect the actual risk posed by insuring a person or business.
Making Informed Decisions
Data science enables businesses to make decisions based on data rather than intuition. By analyzing trends and patterns, companies can identify new market opportunities, understand customer preferences, and respond to changes in the market more swiftly. And this is just a small selection of the possibilities of data science use cases!
How can you get started with data science?
Starting your first data science project can seem like a big task. To help you with this, here are some steps we like to follow while doing a project.
Define your goal
Start by clearly defining the goal of your project. Think about what we try to do and why we are doing it. Also, think about who we are trying to help and involve them in setting goals. A specific goal will help guide your efforts and allow you to measure your success.
Gather and prepare your data
Start gathering data that can be used for the goal you set. This can be data that is available internally, like data about finances, operations, or customers. Or data from external sources like weather data, data about the global markets, or information scraped from websites. Also, consider which data is not readily available now but might be valuable and start collecting this data.
After we’ve gathered our data, we can prepare our data for the next steps. This might involve cleaning the data, dealing with missing values, and transforming variables.
Exploratory Data Analysis (EDA)
Before diving into complex data science approaches, perform EDA to start understanding your data, its patterns, anomalies, or exciting relationships. This knowledge will help you in the next steps.
Choose the right tools and techniques
Depending on your project’s goal, select the appropriate data science approach and tool(s). As discussed above, data science has many ways of extracting value from your data. This could range from regression analysis for predicting numerical values to clustering techniques for segmentation tasks or statistical analysis. The correct approach is dependent on the set goal and the available data. Do some research here; there is often a simple and elegant way to reach your goal.
Also, think about in which tool you want to work in. Do you want a simple tool without (a lot of) coding or a tool that gives you a lot of advanced controls? Should the tool be cloud-based or run locally? If you already have a solid data infrastructure, consider compatibility with your current system. Choosing the right tool is dependent on the situation and the project. Do you want some inspiration on how to get this internal knowledge up? Have a look at how Greenchoice increased its knowledge of Data Science.
Evaluate and Iterate
After executing your data science project, evaluate its performance using appropriate metrics. Use the goals set in the beginning and assess if they can be met with the current results. Be prepared to iterate on your model based on feedback and results to improve its accuracy.
Operationalize
After we have executed the data science project and are happy with the results, we want to start using the outcomes within our organization. The process of operationalizing your data science solution can vary from simple to more advanced and depends again on the type of approach, the tool used, and how the solution will be used. This is why involving the end user in the goal setting is very important.
Conclusion
Data science can be a powerful tool when used effectively, giving your business an advantage. Hopefully, you have learned something about data science and what it might mean for your business, and you know how to kickstart your data science project! If you have any questions or want to brainstorm how to start using data science within your business, please contact us! We can also help you in the first step of defining the correct use cases using our templates and knowledge.
Want to be inspired which tools are available in the market? During our free online event called the Data & Automation Line Up on the 16th of May, we go over the latest developments around data & automation solutions. The choice is yours, from data visualization to data engineering and from low coding to data science! Whether you are looking for something new or want to get more out of your existing solution. You’ll be up-to-date in one afternoon, and you can see the latest features and solutions live in action.
Attend the whole program or just the sessions that are relevant for you at this moment. It’s up to you! More information on the event? Have a look at the full program here.
This might also be interesting for you

Data Science training as the next step in data maturity - Greenchoice
Greenchoice has already taken considerable steps with an ambitious data strategy, future-proof data architecture and a rapidly growing number of end users in the data visualisation environment. However, in order to take the next step in data maturity, Greenchoice has developed an in-company Data Science training in collaboration with Rockfeather. The training’s main objectives were: identify, develop, and implement Data Science use cases. Alex Janssen, Manager Development Consumer and Data & Analytics explains what this training has brought.

Fewer season ticket cancellations through machine learning at ADO Den Haag
Season tickets are one of the most important revenue streams for top-level football clubs. It is therefore in a club’s interest to keep the number of cancellations as low as possible. However, for many clubs it is difficult to estimate who exactly is leaving. In this case study, we show how we used a predictive model to gain insight into potential cancellations at Eredivisie club ADO Den Haag.

Why PowerApps is a great Excel replacement.
In this blog, we are looking at a common scenario in the world of data: Microsoft Excel versus PowerApps. PowerApps offers a great alternative to our traditional spreadsheets. We will explore why it sometimes might be a clever idea to switch from your familiar spreadsheets to the new world of PowerApps.
The start of it all
Excel is the grandfather of organizing data! It has been with us for a long time, helping with calculations, creating graphs, and all sorts of data work. We have made many budgets, tracked expenses, and even mastered pivot tables using Excel. But the amount of data we use is growing, and business processes are getting more complex, so it is crucial to consider newer, more flexible solutions.
So, let us first look at the advantages and disadvantages of good, old Excel:
Microsoft Excel shines with its versatility and robust data visualization tools, making it a go-to for everything from simple sums to fancy charts that clarify trends. I mean – who did not start tracking his personal financial budget in Excel 🤑? Everybody right? And – as you might have encountered – Excel is not ‘that’ heavyweight when you throw large datasets into the ring. It can slow to a crawl, or when too many hands are in the same data cookie jar (spreadsheet), the risk of mix-ups and mistakes can make things messy. Let us not even get started on version control. So, Excel is the perfect jack-of-all-trades, but can stumble with size and teamwork.
That is where PowerApps comes in, Microsoft’s answer to messy cooperations and spreadsheets. PowerApps is a low-code platform you can see as a combination of PowerPoint and Excel. It has Excel’s logic and calculation power and the WYSIWYG (What-You-See-Is-What-You-Get) Design Experience from PowerPoint. It lets you create custom applications (Desktop, Tablet, and phone!) without needing lots of coding skills. So, combine it with a suitable data solution, and you can think of it as the cool, younger, and more powerful sibling of Excel, ready to handle more complicated tasks easily. Let us check some of its advantages and disadvantages:
Advantages of Microsoft Power Apps:
- Swift App Development: With Microsoft Power Apps, you can swiftly develop applications using a low-code or no-code approach. PowerFX, the code you write in Excel, is what you also use to write logic in PowerApps. This means people with diverse technical skills can easily craft custom apps, saving time and resources in the development process.
- Seamless Integration into the Microsoft Ecosystem: Microsoft Power Apps seamlessly blends with other Microsoft 365 and Azure services, creating a unified environment for app development. This integration streamlines data connectivity, collaboration, and the utilization of additional functionalities within the broader Microsoft ecosystem.
- Centralized Data Entry & storage: PowerApps offers a more organized and reliable data management system compared to Excel by providing a single, central form for data entry, reducing versioning errors and data corruption. This ensures a more secure and error-free environment for data, enhancing its integrity and reliability.
Disadvantages of Microsoft Power Apps:
- Learning Curve for Advanced Features: While Power Apps is designed to be user-friendly, mastering its advanced features may pose a learning curve for users with limited technical experience.
- Cost Considerations: The cost of using Power Apps can accumulate based on the scale and complexity of your applications. Organizations must thoughtfully evaluate their needs and opt for appropriate licensing tiers, as certain advanced features may require higher subscription levels.
Is PowerApps better than Excel?
While Excel excels at straightforward data tasks, PowerApps is the go-to for more complex, dynamic challenges. It is not about replacing Excel but complementing it with PowerApps for scalable, app-based solutions. This shift enhances our toolkit, making us more efficient and enabling us to make data-driven decisions. Consider PowerApps to create employee-facing applications built on a robust database while keeping Excel for more straightforward, individual tasks. Let us embrace both to stay efficient and innovative in our data management practices.
Would you like to learn more?
This page is fully dedicated to Microsoft Power Apps, you can also watch a short demo from one of our colleagues! Want more info? Please do not hesitate to contact me via erik.wilbink@rockfeather.com.

Artificial Intelligence is ready!
In this interview, Jonathan Aardema talks with Prof. Eric Postma (professor of Cognitive Science and Artificial Intelligence at the University of Tilburg) about the why, how, and what of artificial intelligence applications. What do we see in practice, and what does science say about it?
Visiting London for the Tableau Partner Executive Kick-Off 2020
Every year Tableau invites its most valuable partners to kick off the new year together. The theme for this year was Accelerate, so let’s get right to the point. This exciting event was focused on three main areas.
Mastering DAX
Keeping your skills up to date is crucial when you work with the newest technology. At Rockfeather, we challenge each other to be the best version of yourself. That’s why I attended the mastering DAX course. DAX (Data Analysis Expressions) is a formula expression language. Next to Power BI, DAX is applied in Excel Power Pivot and tabular models in SQL Server. Learn it once, use it tomorrow.

Row-level security in Power BI
To ensure that data in Power BI reports do not fall into the wrong hands, it is possible to apply Row-Level Security (RLS) to any report within a workspace. This ensures that for each recipient of the report a difference can be made in what data they can see. It is important that the setup is done accurately and that the members of a workspace are assigned the right role to prevent them from seeing too much information, for example. This RLS layout of the online workspaces in Power BI has changed in the last few months. In this blog, we explain what to pay attention to when setting up a new workspace and setting up the renewed RLS in Power BI.
RLS in Power BI in practice
A good example of the application of RLS is in a multi-branch store chain, where each branch manager is responsible for his own store. Each branch manager is only allowed to see the figures of his own store. Because of RLS it is no longer necessary to create a separate report for each store manager.
RLS for published dashboards is set up in Power BI Desktop under the Modeling tab. For each role, the report must indicate which tables are to be filtered. Different columns within a table can be filtered, for example on the Place column. Below is an example of the role for a branch manager in Rotterdam.
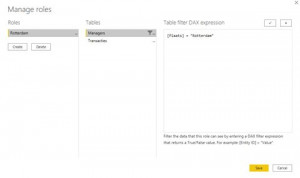
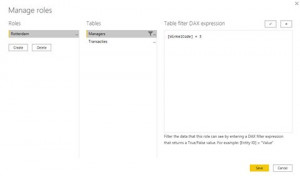
Apply filter storeID
By filtering the region of the store on Rotterdam, the transaction table is also filtered on data from Rotterdam, provided a relationship is established between these two tables. When there are several branches in Rotterdam, managers from this city will be able to view each other’s figures in the current set up. In some cases, this may not be desirable. To prevent this, it is possible in this dataset to filter one level deeper through a unique field per store. In our example this is StoreID. As long as each StoreID in our dataset is unique, each manager will only be able to see data of his own store. A separate role should be created for each manager.
Once the report is published, the email addresses can be added to the corresponding role in the Power BI Service. It is possible to link 1 email address to different roles. This situation can occur when for example a manager (temporarily) takes over another branch. An e-mail address can be deleted at any time, which means that the rights to view the data expire immediately for the person in question. It is therefore important that a designated person maintains and updates the RLS rights.
Roles in new workspaces
As previously mentioned, the functionalities of workspaces have recently been renewed by Microsoft. Within the old workspaces, you could only assign the roles Member or Administrator to a person. In the new situation there are four different roles:
- Viewer is the read-only role. With this role, it is not possible to edit or change reports. Attention! When a report uses RLS, all users must get at least the role of viewer, otherwise the RLS will not work.
- Contributor is the role assigned to persons who need to be able to publish, edit, update and delete reports. This is a role for the developers in the team for example. However, the contributor does not have the right to share reports or add users to the workspaces.
- In addition to publishing, editing and updating, a Member can also share the reports with others. They also have the rights to add users with the same or lower roles (Viewer and Contributer).
- An Admin has all the functionalities that the lower roles have, but in addition administrators can also remove workspaces and make other people administrator. Administrators are also allowed to remove people from the workspaces.
Creating new workspaces
Besides the new roles, creating a workspace is also different. When creating an old workspace, an Office 365 group was always created. With the introduction of the new workspaces, a workspace is created without an Office 365 group. The workspaces only exist in the Power BI environment. Because of this, the workspaces do not automatically appear in for example Teams. In the past, this was experienced as confusing by many users.
It is possible to convert an existing workspace to a new workspace. This is easy to change under the advanced settings. This option can be found in the workspace settings.

In the old workspaces, all members can be seen separately. When converting to the new workspace, these members are clustered into a group with the name of the workspace. You can see which members are in the group on the Office 356 site. We recommend converting old workspaces to new workspaces so you can assign more specific roles to people.
This concludes RLS in Power BI. If you want to know more about RLS or Power BI in general, please contact Paul!
Latest Blog Posts
Artificial Intelligence is ready!
In this interview, Jonathan Aardema talks with Prof. Eric Postma (professor of Cognitive Science and Artificial Intelligence at the University of Tilburg) about the why, how, and what of artificial intelligence applications. What do we see in practice, and what does science say about it?
Visiting London for the Tableau Partner Executive Kick-Off 2020
Every year Tableau invites its most valuable partners to kick off the new year together. The theme for this year was Accelerate, so let’s get right to the point. This exciting event was focused on three main areas.
Mastering DAX
Keeping your skills up to date is crucial when you work with the newest technology. At Rockfeather, we challenge each other to be the best version of yourself. That’s why I attended the mastering DAX course. DAX (Data Analysis Expressions) is a formula expression language. Next to Power BI, DAX is applied in Excel Power Pivot and tabular models in SQL Server. Learn it once, use it tomorrow.

- All solutions at a glance within the Azure Integration Services
- Automating Data Processes
- Integration as a service vs analytics integrations
All you need to know about Microsoft Data Integration Services
What is Microsoft Data Integration Services
In this blog we explain you all you need to know about Microsoft Data Integration Services. Microsoft Data Integration Services divides into two categories:
- On-premise, (local) variant. You work locally on a server, and you develop the integrations and workflows on this server. We call this SQL Server Integration Services (SSIS).
- Azure Integration Services (AIS): Here, you work on the cloud platform of Microsoft (Azure), and the Integration service consists of various solutions, which together form the integration solutions of Microsoft. This set of solutions together is called the Microsoft Azure Integration Services.
In this blog, we will only focus on the different solutions within the AIS platform.
What does Microsoft Azure Integration Services?
AIS is mainly intended to move data and is an umbrella name for five solutions contained within it. You can think of transferring data from the various systems of an organization to a data warehouse (data hub) environment. AIS has connectors to make connections to such systems. The data that can be retrieved in different formats:
- Structured data (data in tables)
- Semi-structured data (email, PDF, HTML)
- Unstructured data (video and photo)
The different solutions within AIS can be divided into two application areas: Integration as a service and Analytics
Integration as a service (IAAS)
IAAS is characterized by real-time data shifts between numerous systems and is often the heart of a company. Think of an order placed in a web application and moved to the accounting system and an order management system using an IPAAS (Integration Platform as a Service). This type of data integration is often near real-time and event-based. Also, many of the integrations are based on APIs. The solutions in the Azure Integration Services that are used for this include Logic Apps, Service Bus, API Management, and Event Grid
Analytics integration
Different systems are made accessible in analytics applications, and this data from the various sources is written into a data hub. You can then use this data in many other systems. Consider, for example, the reporting tool PowerBI or Tableau. The loading and preparation of the data takes place separately in a central environment. This creates consistent results that can be reused. In this case, data (unlike IAAS) usually loads in batches. There is also a more direct connection to source systems, and data refreshes are usually scheduled or triggered. The Azure Integration Services solutions used for this include Logic Apps, Azure Data Factory, and Azure Analysis Services.
Here is a brief overview of these different solutions from both domains and what they can do:
- Logic Apps: With Logic Apps, you create transparent workflows (workflows) to connect to different systems using APIs. These workflows run in the predefined order when the trigger is fired.
- Service Bus: Azure Service Bus is a cloud messaging service that connects all applications, devices, and services running in the cloud to other applications or services.
- API Management: A hybrid multi-cloud management platform for APIs in all environments. In this way, internal and external developers can connect to the back-end systems at any time.
- Event Grid: Event Grid is an integrated service for managing the routing of all events from any source to any destination (what happens when and where the data should go based on the event).
- Azure Data Factory: Azure Data Factory is a cloud-based data integration service that allows you to create data-driven workflows in the cloud and automate data movement and data transformation.
Benefits of Microsoft Data Integration Services
- Centrally manageable
- Consistent transformations on the data
- Clear to work with through process flows
- An unprecedented number of connectors to unlock source systems
- Easy to make transformations on the date
Rockfeather & Microsoft Data Integration Services
With Rockfeather, we use these solutions by creating an intermediate layer when we retrieve the data from systems, whether this is for an IAAS question or more for an Analytics question.
For example, we provide access to the ERP system, an HR system, and a tool with an API. We can write all this to a data hub. We then use these as a source for the solutions as mentioned above. The advantage of this is that we can load the same results regardless of the solution. In addition, it is efficient and clear to retrieve the data and transform it where necessary. After we have all this down, it will continue to update fully automatically.
Automated reports with Power BI Report Builder
The fact that Power BI can be used to create dashboards is by now known to many organisations. However, many people do not know that there is a tool within Power BI that can help when there is a specific demand for (automated) PDF or Excel reports. This tool is called Power BI Report Builder. In this article, we will take a closer look at Power BI Report Builder to give you a better understanding of this tool.

Harvest data from your entire business
As the worlds of Finance and IT are moving closer and closer, companies are looking to harvest the vast amounts of data within their domain and use it for their benefit. Our customers are looking to insert a data driven mindset within their company. On one hand that is achieved through a broader consumption of data within the company, but also to combine several data sources in one reporting platform.

Learn about the best kept secret for better Power BI dashboards
On January 28th our webinar “The best-kept secret for better Power BI dashboards” took place. In this webinar, we showed you how to drastically improve your Power BI dashboards with the help of International Business Communication Standards (IBCS) and the Zebra BI plug-in. Click here to watch a recording of this free webinar.