Gartner’s Magic Quadrant for data science and machine learning platforms
Are you looking for a Data Science and Machine Learning solution? Then Gartner's Magic Quadrant for data science and machine learning platforms is a valuable resource. A lot of people only look at the famous 2-by-2-matrix, but there is much more than just this matrix. That's why we dug into the dirty details of the full report and put all this into a 20-minute webinar. In this webinar, we will show you all the vendors that are scored as a leader in Gartner's 2020 Magic Quadrant for Data Science and Machine Learning Platforms.
Gartner’s Magic Quadrant
A magic quadrant for data science is interesting but who are the main users of these toolsets? Data Scientist is a relatively new profession. We typically see two sorts of data scientists. The first one is the data analyst/business controller who does not have a lot of code or programming skills but still wants to create an accurate prediction to help decision making. This group is also known as the Citizen Data Scientists. The other group is the one including all the expert/hardcore data scientists, who love to use code to get the best possible prediction for their use case. For both groups the magic quadrant is a valuable resource; the quadrant includes toolsets for both types of data scientists.
What do we cover?
We start the webinar with an explanation of the Magic Quadrant for Data Science and Machine Learning (DSML) Platforms. After that, we will show the MQ with all the scored vendors. Once we showed all the vendors, we will take a deep dive into the details of the leading vendors. The strengths and cautions of the leading vendors will be discussed, besides the vendor’s development over the last three years.
Watch the webinar!
Are you looking for a DSML solution, whether you are a citizen or a hardcore data scientist? This webinar gives you insight into which of the leading vendors will be the best fit for you.
Watch the full webinar
Watch the full webinar in just 20 minutes and know everything there is to know about this year's Gartner's Magic Quadrant for Data Science and Machine Learning (DSML) Platforms. Just fill out the form and you will get instant access. Don't worry we won't give your details to anybody else and we won't spam you with non-relevant info.
Gartner's Magic Quadrant for Data Science and Machine Learning (DSML) Platforms
Watch the full webinar in just 20 minutes and know everything there is to know about this year's Magic Quadrant for Analytics and BI.
-
Gartner's Magic Quadrant for Data Science and Machine Learning (DSML) Platforms


Gartner Magic Quadrant for Business Intelligence Platforms and Analytics 2020
The Gartner Magic Quadrant for Business Intelligence is a piece of analyst reporting we look forward to every year. Both the dept and the scope of this research makes it worth the read. But not many people take the time to really dig into the details of the report.

Preventing churn for more loyal customers - that's the dream
There is one thing that’s just as important as finding new clients: keeping your current clients. This blog will give you some practical tips to increase your loyal customer group!
The Best Data Science Webinars
Day to day hectic is always the enemy of your ambition to acquire new skills and gain knowledge in the fields you identified. These special times offer the opportunity for some of us to spend some extra time to invest in yourself to learn new things. For those of you who have the ambition to learn more about data science we made a selection of the webinars from the people at Alteryx to learn more about this subject.
Dashboards with Impact
In my eight years as a consultant, I've probably seen more dashboards than I can count. Still, most of them don't have the impact they should have. Nine out of ten times, people start looking at the data. Is there something wrong with the underlying data-sets? Or is the visual not clear enough? Looking at those elements isn't bad, but in my opinion, you're looking in the wrong direction.
Dashboards without Impact
By starting with simple questions, you’ll avoid an endless search in your data-sets asking yourself: why aren’t people listening? Why aren’t people using my dashboards? To cheer you up, you’re not the first wondering why the insights you uncovered don’t have an impact.
How IBCS started
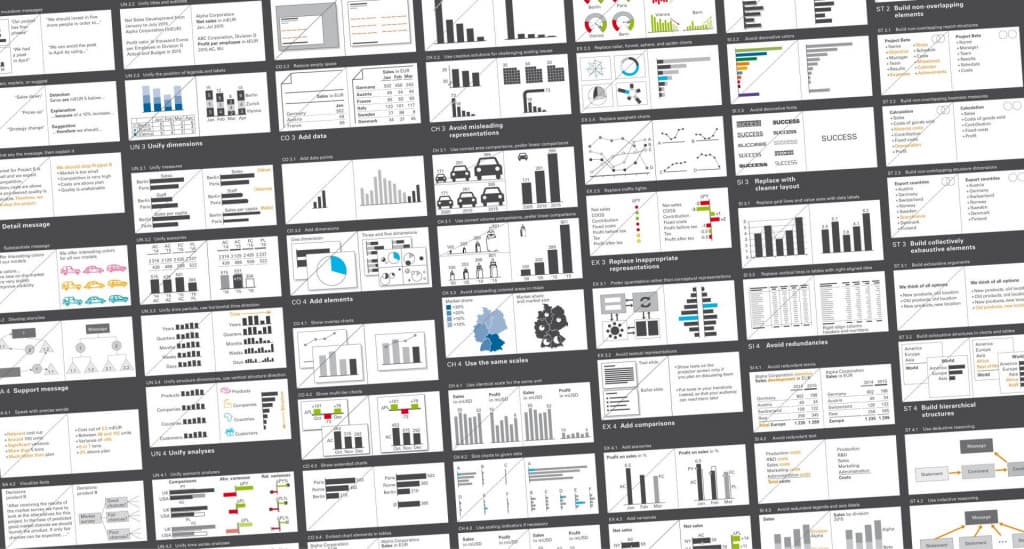
In the ’80s, a man called Rolf Hichert had the same problem. That’s why he started the IBCS (International Business Communication Standards). His motto was: If musicians can visualize a symphony with the help of sheet music, then business people should be able to find a standard notation for monthly sales. In other words: if you don’t have a standard or a language, there is a big chance people won’t understand your dashboard. And if they don’t understand it, there won’t be an impact of any kind.
How to use IBCS?
Using IBCS standards isn’t hard; you have to be consistent. We always start with the message: what is the message of your dashboard? What do you want people to remember after the meeting is over? When the message is clear, the rest comes naturally. Every great message has a great title. You want to impress when you start, so choose something to wake people up.
Timing and structure
The next step is the period. If the period is too long, people won’t see the urgency of your data. If the period is too short, then people might miss a trend that has been developing over time. So choosing the right period can be tough. It takes training and experience to make the right choices. The last step is the structure of your dashboard. Keep the IBCS structures as the red line so that people will recognize the information from the beginning to the end.
What is in it for you
The Future of Data & Automation: Your Roadmap for 2025
Forrester Research predicts that companies with smart Data & Automation programs will not only overtake their competitors, but crush them. When you integrate Data & Automation well, you’ll have a big head start over the competition. During “The Future of Data & Automation: Your Roadmap for 2025” we give you the tips and tricks you need to let your solid ideas take flight.

Mastering Dashboard Success: Requirements & Storytelling
Although it is essential, the value your dashboard can achieve is not entirely dependent on the data you have available. It can become equally important to show the story behind your data in the most efficient way possible while critically assessing the audience for and purpose of your dashboard. A lack of focus on those fundamentals can result in an abundance of reports created without properly considering business needs.
10+ Data and Automation Solutions that will transform your business
Use this webpage for information about more than 10 solutions that we think will help your solid ideas take flight. A Data & Automation solution Line Up so to say.

Gartner Magic Quadrant for Analytics and Business Intelligence Platforms 2020
The Gartner Magic Quadrant for Business Intelligence is a piece of analyst reporting we look forward to every year. Both the dept and the scope of this research makes it worth the read. But not many people take the time to really dig into the details of the report. Moreover, the only thing people see is the well known two-by-two matrix. We took the time to read all of the 38 pages of this year's report and we included the most important findings in our webinar that you can watch at the bottom of this page.
What is the Gartner Magic Quadrant for Business Intelligence and Analytics?
Gartner is an American IT research company. It maps the market for IT solutions and this research is summarized in a compact 2-by-2 matrix. The horizontal axis shows the ‘completeness of vision’ and the vertical axis shows ‘ability to execute’. It creates four quadrants in which the solutions are positioned as dots. All in all, Gartner currently produces just under 150 of these quadrants. One of these quadrants is Magic Quadrant for Analytics and Business Intelligence Platforms. You can find the full report on Gartner’s website here.
Strategic Planning Assumptions
Based on the research for the magic quadrant Gartner formulates a set of so-called strategic planning assumptions. We can formulated the following assumptions:
- In 2022: augmented analytics technology will be ubiquitous. However, only 10% of analysts will use its full potential.
- By 2022: 40% of machine learning model development and scoring will be done in products that do not have machine learning as their primary goal.
- In 2023: 90% the world’s top 500 companies will have converged analytics governance into broader data and analytics governance initiatives.
- By 2025: 80% of consumer or industrial products containing electronics will incorporate on-device analytics.
- Finally, by 2025: data stories will be the most widespread way of consuming analytics and 75% of stories will be automatically generated using augmented analytics techniques.
How are the different vendors performing?
This year’s magic quadrant clearly shows two vendors leading the pack. Tableau and Microsoft’s Power BI are top right in the leader quadrant. Next to these leaders, a number of surprising new vendors make their way through the quadrant. If you want to learn all the details you should just watch the webinar. As a result we can assure you that in only 20 minutes you are completely up to date. You should try it out.
Watch the full webinar
Watch the full webinar in just 20 minutes and know everything there is to know about this year's Magic Quadrant for Analytics and BI. Just fill out the form and you will get instant access. Besides, don't worry! We won't give your details to anybody else and we won't spam you with non-relevant info.
Gartner's Magic Quadrant for Business Intelligence & Analytics
Watch the full webinar in just 20 minutes and know everything there is to know about this year's Magic Quadrant for Analytics and BI.
-
Gartner's Magic Quadrant for BI & Analytics


Artificial Intelligence is ready!
In this interview, Jonathan Aardema talks with Prof. Eric Postma (professor of Cognitive Science and Artificial Intelligence at the University of Tilburg) about the why, how, and what of artificial intelligence applications. What do we see in practice, and what does science say about it?

Mastering DAX
Keeping your skills up to date is crucial when you work with the newest technology. At Rockfeather, we challenge each other to be the best version of yourself. That’s why I attended the mastering DAX course. DAX (Data Analysis Expressions) is a formula expression language. Next to Power BI, DAX is applied in Excel Power Pivot and tabular models in SQL Server. Learn it once, use it tomorrow.
The Best Data Science Webinars
Day to day hectic is always the enemy of your ambition to acquire new skills and gain knowledge in the fields you identified. These special times offer the opportunity for some of us to spend some extra time to invest in yourself to learn new things. For those of you who have the ambition to learn more about data science we made a selection of the webinars from the people at Alteryx to learn more about this subject.

Mastering DAX
Keeping your skills up to date is crucial when you work with the newest technology. At Rockfeather, we challenge each other to be the best version of yourself. That’s why I attended the mastering DAX course. DAX (Data Analysis Expressions) is a formula expression language. Next to Power BI, DAX is applied in Excel Power Pivot and tabular models in SQL Server. Learn it once, use it always.
King of Data Analysis Expressions
After attending the Data modeling course of SQLBI in the fall, I was excited to participate in the mastering course. Three-days full of learning about the query language. Throughout the three days, Marco Russo told a lot of best practices. Marco runs SQLBI with his co-founder Alberto Ferrari. Together, they wrote several books about Microsoft Business Intelligence software.
Performance development
When you develop your reports and dashboard, you will learn that the xVelocity engine in Power BI works well with a lot of rows, even faster when there are a lot of columns with a lot of repeating values. The list of distinct values is shorter and more comfortable with compressing in Power BI.
On the last day of the course, Marco demonstrated the performance function in Power BI, called the Performance Analyzer. This function has been there since the Power BI Desktop release of May 2019 and records all the proceedings on the dashboard. After that, the solution shows you a report of all the performance data. This report illustrates the duration in milliseconds of every visual in your report. Use the Refresh visual button for comparing performance between sessions or reports, because capturing the initial load can be misleading. The initial amount executes different necessary procedures. This report shows you where you can improve your dashboard and make more impact with it.
Efficiency by DAX
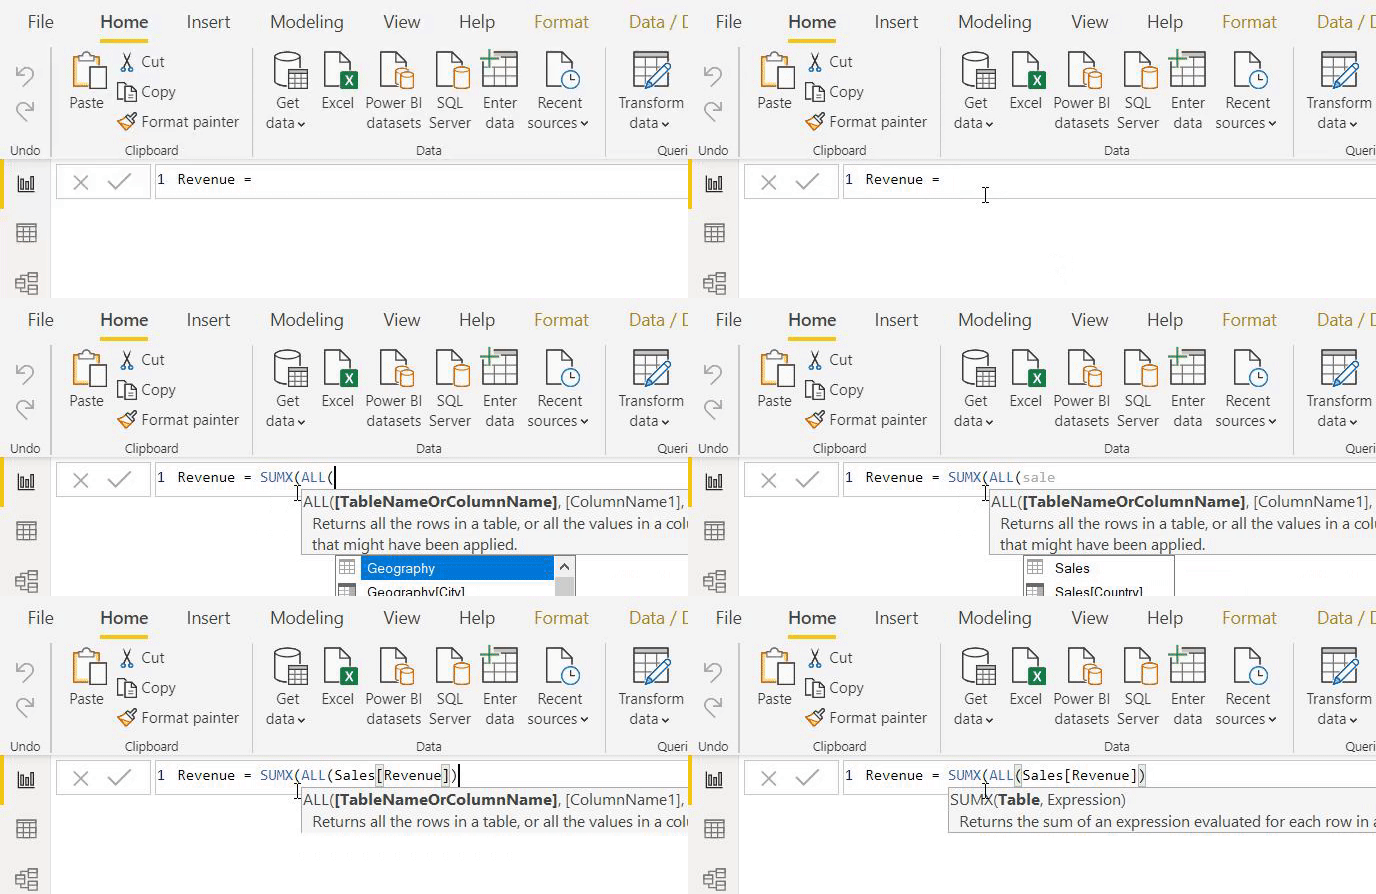
Another significant performance upgrade is the replacement of a table definition for a column in aggregated or filter functions. Because of this, DAX doesn’t have to load an entire table for a DAX-query, just a few columns will do the trick. Working with a few columns instead of a whole chart saves a lot of time in loading your report.
Sum it Up
To sum up: I’ve learned a lot during my time at the mastering DAX Course. Next to a lot of time-saving upgrades, I feel like the solution is getting more user-friendly and smarter every time I come back at DAX.

The Future of Data & Automation: Your Roadmap for 2025
Forrester Research predicts that companies with smart Data & Automation programs will not only overtake their competitors, but crush them. When you integrate Data & Automation well, you’ll have a big head start over the competition. During “The Future of Data & Automation: Your Roadmap for 2025” we give you the tips and tricks you need to let your solid ideas take flight.

Mastering Dashboard Success: Requirements & Storytelling
Although it is essential, the value your dashboard can achieve is not entirely dependent on the data you have available. It can become equally important to show the story behind your data in the most efficient way possible while critically assessing the audience for and purpose of your dashboard. A lack of focus on those fundamentals can result in an abundance of reports created without properly considering business needs.

10+ Data and Automation Solutions that will transform your business
Use this webpage for information about more than 10 solutions that we think will help your solid ideas take flight. A Data & Automation solution Line Up so to say.

Visiting London for the Tableau Partner Executive Kick-Off 2020
- Platform positioning (Tableau & Salesforce)
- Blueprint
- Product roadmap 2020
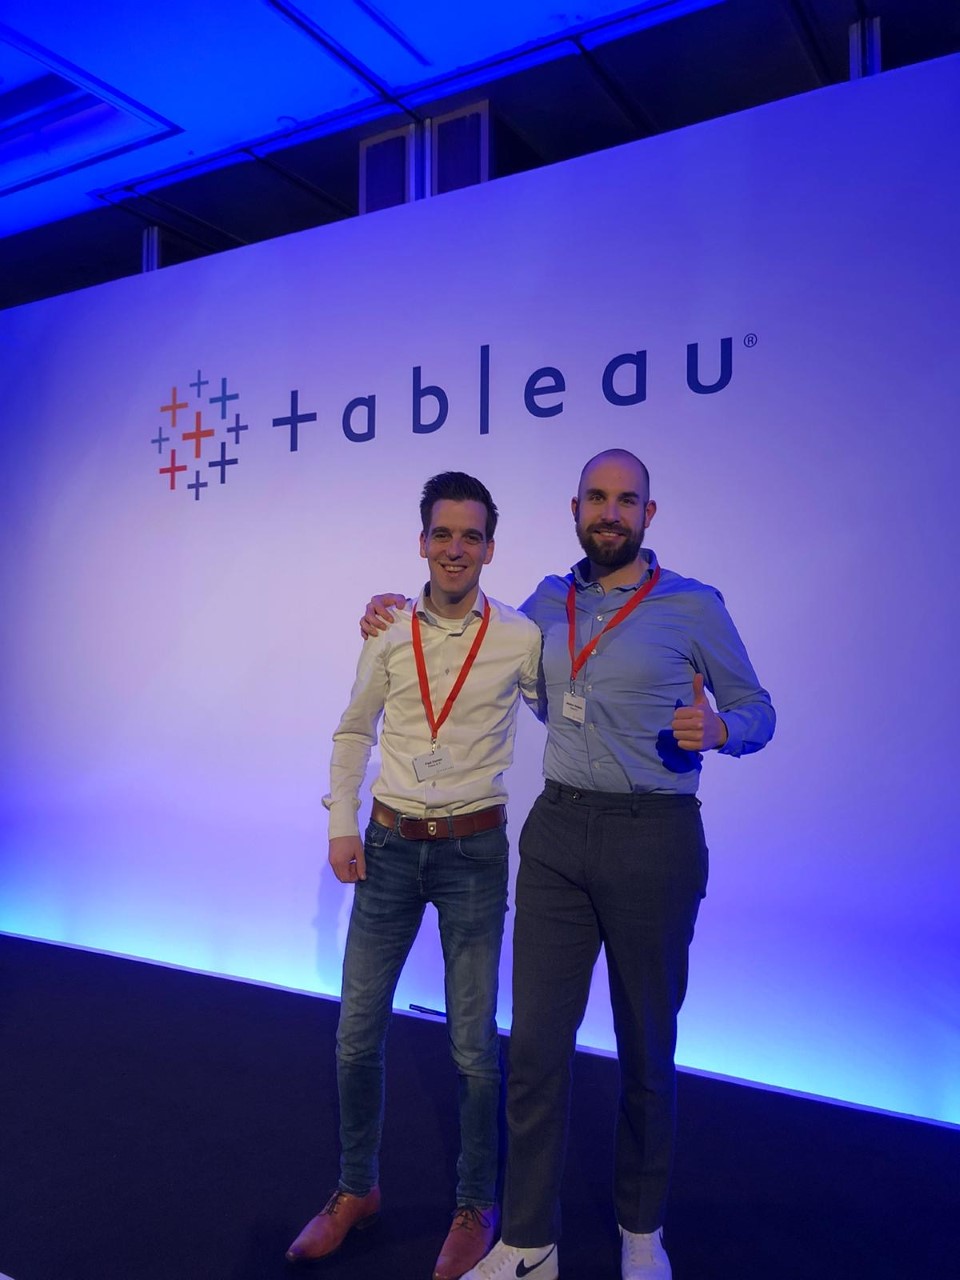
Every year Tableau invites its most valuable partners to kick off the new year together. The theme for this year was Accelerate, so let’s get right to the point. This exciting event was focused on three main areas:
- Platform positioning (Tableau & Salesforce)
- Blueprint
- Product roadmap 2020
On top of the inspiration sessions, presentations and live demos, it’s always a thrill to share our passion for data with like-minded people to exchange best-practices and drinks.
No shit, Einstein!
For most of you in the data & analytics field, it has not been a surprise that in 2019 Salesforce acquired Tableau for a whooping amount of 15.7 billion dollars. Everybody in the audience was eager to know what would be the plan of attack to marry up these two software giants. As in real life, high expectations are often accompanied by disappointments. Tableau mentioned that Tableau and Salesforce are (still) working through what the long-term product roadmap will look like. A wise man (Einstein) once said: “The most beautiful experience we can have is the mysterious.” That is precisely the current status of the strategy for Salesforce and Tableau. It’s mysterious. However, Salesforce, Tableau, and Einstein Analytics will continue to be supported and developed.
Salesforce, Tableau and Einstein Analytics in the mix
Salesforce is undoubtedly the #1 platform in the world with massive amounts of sales and customer data used as fuel for Einstein Analytics. Einstein Analytics allows you to explore all of your data quickly and easily by providing AI-powered analytics, right in Salesforce. On the other hand, Tableau has been a leader in the Gartner of Analytics and BI platforms for over seven years. It’s easy to see how these tools will ultimately come together over time.
The short term efforts are focused on integrating Salesforce data even more seamlessly into Tableau by enhancing the current Salesforce connectors. Subsequently, some of the Einstein Analytics functionalities will be available to pump back into Tableau. As always, the future looks promising, especially for those that are already enjoying Salesforce and/or Tableau, and want to grow in their data maturity level even more by topping it off with Einstein Analytics.
Tableau Blueprint
During our stay in London, we have received additional information and exchanged best practices regarding the Tableau Blueprint. Tableau Blueprint is a step-by-step manual to becoming a data-driven organization. No matter the data maturity of your company, the use of data always needs to be broadened, deepened and scaled. Transforming how your company makes decisions every day is a daunting task. However, incorporating data and analytics into decision-making processes is how you will make the most impact on your organization.
Achieving that level of transformation requires a holistic approach to developing your analytics practice. Although every organization’s data journey will differ, Tableau Blueprint outlines the processes and best practices from numerous customers.
This masterclass gave us lots of energy and confirmation of our project approach to help organizations with improved decision making instead of just creating visually appealing dashboards. Therefore we can highly advise you to start experimenting with the Blueprint together with your data champions.
Product roadmap
Without further ado, we bring to you the innovations that lay ahead in 2020. Below you will find the most promising features:
- Self-Service Analytics
- Animations and dynamic parameters (excellent!)
- Augmented Analytics
- Ask data (custom suggestion)
- Explain data usability improvements (handy!)
- Data Management
- Salesforce connector update to latest APIs
- Visual LODs
- Prep – Write to the database and Incremental refresh (Whoop Whoop)
- Mobile
- Metrics overview
- Server
- Single node containes
- SAN support for backups
- Online
- Cloud standard. Tableau is mainly used as a desktop product, but in the future, we will see that more and more functionalities will become available in the cloud. This has two main advantages 1) always using the latest version and 2) better performance
- Licensing
- Login based License Management (Score!)
- Einstein Analytics
-
- Predictions in Tableau
- Pre-built Predictive use cases for all industries
If you want to know more, please make sure to check out our latest Tableau content!

Artificial Intelligence is ready!
In this interview, Jonathan Aardema talks with Prof. Eric Postma (professor of Cognitive Science and Artificial Intelligence at the University of Tilburg) about the why, how, and what of artificial intelligence applications. What do we see in practice, and what does science say about it?

How old-fashioned corporate technology kills sustainable ambitions
Creating sustainable businesses is definitely one of the biggest challenges for big corporations. The ‘why’ in this story is clear as daylight, it is the ‘how’ and ‘what’ that is nagging them.

Mastering DAX
Keeping your skills up to date is crucial when you work with the newest technology. At Rockfeather, we challenge each other to be the best version of yourself. That’s why I attended the mastering DAX course. DAX (Data Analysis Expressions) is a formula expression language. Next to Power BI, DAX is applied in Excel Power Pivot and tabular models in SQL Server. Learn it once, use it tomorrow.

AI is ready!
In this interview, Jonathan Aardema interviews Prof. Eric Postma (professor of Cognitive Science and Artificial Intelligence at Tilburg University) about the why, how, and what of artificial intelligence applications. What do we see in practice, and what does science say about it?
Within companies, I see a lot of people who don’t quite know what falls under Artificial Intelligence (AI). What is your view from the perspective of science?
Very sober. Artificial Intelligence is nowadays a buzzword, but the field has been around since the 1950s. A lot of people claim that machines can do things faster and better than people, but machines have been doing that for quite a long time. Take a pocket calculator, which can count much faster than most people.
What is new is speech and image recognition. AI is very good at recognizing patterns without knowing the context. Consider, for example, the automatic recognition of skin cancer from skin images. AI performs better than people but does not know or understand anything about the patient himself. We call it Narrow AI. That is more limited than what people can do, but that doesn’t matter. A pocket calculator is also more limited, but does what it has to do, namely calculating. Still, people decide on the conclusion from the calculations.
In practice, we see that many organizations now want to take steps around AI, for example, about image recognition. Why is it now emerging?
The big breakthrough is deep learning. That too is already 30 years old but appears to work well if you increase the volume of data and more computer power. Then you can, for example, label images of a dog and train the system to recognize dog breeds. The system can do that very well, just as well as people, but it sometimes makes stupid mistakes that people would never make.
Another example is the recognition of breast cancer on scans. A study has just been completed, which showed that AI could do that better than specialists. A system does not receive a lunch dip and does not get tired after assessing too many scans in succession. That is also narrow AI; you only train the system to recognize spots; you don’t need to know more. What happens next is up to the doctor. I see this as a reinforcement of the instruments. The big question is: how are we going to utilize the complementarity of man and machine optimally — some things people can do better than a computer.

We are working on the development of a model to reduce absenteeism in healthcare. We study the variables that predict to prevent disease. Half a percent less absenteeism quickly yields a lot for thousands of employees. We also see that, in addition to the models, human judgment remains essential.
That’s right. Then you get hybrid intelligence, where a human operator works together with a deep learning system. The most significant limitation of AI systems is that they do not know the world. As a human being, you gain knowledge from your baby time, and we do not yet know how to transfer this broad knowledge to systems.
I, therefore, see more of a future in which you develop AI to compensate for the weaknesses of people and vice versa. It is about the combination of the power of the system and the power of the expert.
How do you enroll AI within an organization? In practice, we notice that starting small can also work within traditional organizations. What does science say; do you have to adjust existing elements or start all over again?
I think it makes sense that many companies still have cold feet because it is not yet a proven process. Moreover, I expect AI to play an increasingly important role in all branches of industry. I am not a consultant, but my advice would be to start small and then expand. For companies with a successful business, it is wise to keep the existing business model and also to build a new model around AI carefully. The alternative is a radical change, for which you need other staff. TNT, for example, has deliberately chosen to become a data-driven company. They now use predictive models to predict when someone will be home.
With the evolution of these kinds of developments, new risks arise. What challenges do you see?
The biggest challenge is how we, as a society, deal with the developments around data. How do we ensure the right balance between innovation and the protection of privacy? Take the patient’s file. You can use this to improve patient care, but how do you protect the data in an ethical matter?
Another challenge is how to deal with the power of the systems and the power of the experts. An expert is an expert; never make the mistake of having a machine override the expert. A problem may be that the system consistently does something wrong. How do you fix that, and how do you deal with it in your process? If you want to gain confidence in the system, you also want to be able to see where it makes mistakes. Making mistakes isn’t that bad, people also make mistakes, as long as you know where.
Ultimately, the greatest threat is human. Everyone can apply deep learning, but not everyone knows the basic principles of statistics and analysis that is needed to do it well.
The developments from science to practice are in full swing. Where is Artificial Intelligence now, do you expect significant innovations?
The technology is already there and reaches the point of saturation. There will be improvements, making the systems more robust and requiring fewer data. The real innovation is often in the search for practical applications where you can make a difference with AI. It is not just about the technology and the identification of tasks, but also about the human and organizational side. For example, we are now investigating the recognition of fractures on X-rays. These types of solutions take time; it takes about ten years before you have integrated it into the working methods of the hospital and with the health insurer. But that it will happen is inevitable.

How old-fashioned corporate technology kills sustainable ambitions
Creating sustainable businesses is definitely one of the biggest challenges for big corporations. The ‘why’ in this story is clear as daylight, it is the ‘how’ and ‘what’ that is nagging them.

Visiting London for the Tableau Partner Executive Kick-Off 2020
Every year Tableau invites its most valuable partners to kick off the new year together. The theme for this year was Accelerate, so let’s get right to the point. This exciting event was focused on three main areas.

